Secrets
Non-secret information or fields may be available via the HTTP API and/or logs.
In Prometheus, metadata retrieved from service discovery is not considered
secret. Throughout the Prometheus system, metrics are not considered secret.
Fields containing secrets in configuration files (marked explicitly as such in
the documentation) will not be exposed in logs or via the HTTP API. Secrets
should not be placed in other configuration fields, as it is common for
components to expose their configuration over their HTTP endpoint. It is the
responsibility of the user to protect files on disk from unwanted reads and
writes.
Secrets from other sources used by dependencies (e.g. the
environment variable as used by EC2 service discovery) may end up exposed due to
code outside of our control or due to functionality that happens to expose
wherever it is stored.
Prometheus
It is presumed that untrusted users have access to the Prometheus HTTP endpoint
and logs. They have access to all time series information contained in the
database, plus a variety of operational/debugging information.
It is also presumed that only trusted users have the ability to change the
command line, configuration file, rule files and other aspects of the runtime
environment of Prometheus and other components.
Which targets Prometheus scrapes, how often and with what other settings is
determined entirely via the configuration file. The administrator may
decide to use information from service discovery systems, which combined with
relabelling may grant some of this control to anyone who can modify data in
that service discovery system.
Scraped targets may be run by untrusted users. It should not by default be
possible for a target to expose data that impersonates a different target. The
option removes this protection, as can certain relabelling
setups.
As of Prometheus 2.0, the flag controls access to the
administrative HTTP API which includes functionality such as deleting time
series. This is disabled by default. If enabled, administrative and mutating
functionality will be accessible under the paths. The
flag controls HTTP reloads and shutdowns of
Prometheus. This is also disabled by default. If enabled they will be
accessible under the and paths.
In Prometheus 1.x, and using on are
accessible to anyone with access to the HTTP API. The endpoint is
disabled by default, but can be enabled with the
flag.
The remote read feature allows anyone with HTTP access to send queries to the
remote read endpoint. If for example the PromQL queries were ending up directly
run against a relational database, then anyone with the ability to send queries
to Prometheus (such as via Grafana) can run arbitrary SQL against that
database.
Подготовка сервера
Настроим некоторые параметры сервера, необходимые для правильно работы системы.
Время
Для отображения событий в правильное время, необходимо настроить его синхронизацию. Для этого установим chrony:
а) если на системе CentOS / Red Hat:
yum install chrony
systemctl enable chronyd
systemctl start chronyd
б) если на системе Ubuntu / Debian:
apt-get install chrony
systemctl enable chrony
systemctl start chrony
Брандмауэр
На фаерволе, при его использовании, необходимо открыть порты:
- TCP 9090 — http для сервера прометеус.
- TCP 9093 — http для алерт менеджера.
- TCP и UDP 9094 — для алерт менеджера.
- TCP 9100 — для node_exporter.
а) с помощью firewalld:
firewall-cmd —permanent —add-port=9090/tcp —add-port=9093/tcp —add-port=9094/{tcp,udp} —add-port=9100/tcp
firewall-cmd —reload
б) с помощью iptables:
iptables -I INPUT 1 -p tcp —match multiport —dports 9090,9093,9094,9100 -j ACCEPT
iptables -A INPUT -p udp —dport 9094 -j ACCEPT
в) с помощью ufw:
ufw allow 9090,9093,9094,9100/tcp
ufw allow 9094/udp
ufw reload
SELinux
По умолчанию, SELinux работает в операционный системах на базе Red Hat. Проверяем, работает ли она в нашей системе:
getenforce
Если мы получаем в ответ:
Enforcing
… необходимо отключить его командами:
setenforce 0
sed -i ‘s/^SELINUX=.*/SELINUX=disabled/g’ /etc/selinux/config
* если же мы получим ответ The program ‘getenforce’ is currently not installed, то SELinux не установлен в системе.
prometheus-pushgateway
Установка и настройка
# apt install prometheus-pushgateway

# cat /etc/prometheus/prometheus.yml
...
  - job_name: 'pushgateway'
    honor_labels: true
    static_configs:
    - targets:
Проверка конфигурации и перезапуск
Пример prometheus pushgateway на bash
# cat ip_dhcp_binding.sh
#!/bin/sh

unset http_proxy
DHCP_SERVER=router
NET=192.168

COUNT=`rsh ${DHCP_SERVER} show ip dhcp binding | grep ${NET} | wc -l`

cat << EOF | curl --data-binary @- http://127.0.0.1:9091/metrics/job/cisco_dhcp/dhcp_server/${DHCP_SERVER}/net/${NET}
  ip_dhcp_binding ${COUNT}
EOF
ip_dhcp_binding{dhcp_server="router",job="cisco_dhcp",net="192.168"}
# crontab -l
* * * * * /root/ip_dhcp_binding.sh
Authentication, Authorization, and Encryption
In the future, server-side TLS support will be rolled out to the different
Prometheus projects. Those projects include Prometheus, Alertmanager,
Pushgateway and the official exporters.
Authentication of clients by TLS client certs will also be supported.
The Go projects will share the same TLS library, which will be based on the
Go vanilla crypto/tls library.
We default to TLS 1.2 as minimum version. Our policy regarding this is based on
Qualys SSL Labs recommendations, where we strive to
achieve a grade ‘A’ with a default configuration and correctly provided
certificates, while sticking as closely as possible to the upstream Go defaults.
Achieving that grade provides a balance between perfect security and usability.
TLS will be added to Java exporters in the future.
If you have special TLS needs, like a different cipher suite or older TLS
version, you can tune the minimum TLS version and the ciphers, as long as the
cipher is not
in the crypto/tls library. If that still
does not suit you, the current TLS settings enable you to build a secure tunnel
between the servers and reverse proxies with more special requirements.
![Сервис_prometheus [методические материалы лохтурова вячеслава]](https://myeditor.ru/wp-content/uploads/e/e/c/eec9e199d1b92366234af0615ea03f2e.png)

HTTP Basic Authentication will also be supported. Basic Authentication can be
used without TLS, but it will then expose usernames and passwords in cleartext
over the network.
On the server side, basic authentication passwords are stored as hashes with the
bcrypt algorithm. It is your
responsibility to pick the number of rounds that matches your security
standards. More rounds make brute-force more complicated at the cost of more CPU
power and more time to authenticate the requests.
Various Prometheus components support client-side authentication and
encryption. If TLS client support is offered, there is often also an option
called which skips SSL verification.
prometheus-pushgateway
Установка и настройка
# apt install prometheus-pushgateway

# cat /etc/prometheus/prometheus.yml
...
  - job_name: 'pushgateway'
    honor_labels: true
    static_configs:
    - targets:
Проверка конфигурации и перезапуск
Пример prometheus pushgateway на bash
# cat ip_dhcp_binding.sh
#!/bin/sh

unset http_proxy
DHCP_SERVER=router
NET=192.168

COUNT=`rsh ${DHCP_SERVER} show ip dhcp binding | grep ${NET} | wc -l`

cat << EOF | curl --data-binary @- http://127.0.0.1:9091/metrics/job/cisco_dhcp/dhcp_server/${DHCP_SERVER}/net/${NET}
  ip_dhcp_binding ${COUNT}
EOF
ip_dhcp_binding{dhcp_server="router",job="cisco_dhcp",net="192.168"}
# crontab -l
* * * * * /root/ip_dhcp_binding.sh
Alertmanager
Any user with access to the Alertmanager HTTP endpoint has access to its data.
They can create and resolve alerts. They can create, modify and delete
silences.
Any secret fields which are templatable are intended for routing notifications
in the above use case. They are not intended as a way for secrets to be
separated out from the configuration files using the template file feature. Any
secrets stored in template files could be exfiltrated by anyone able to
configure receivers in the Alertmanager configuration file. For example in
large setups, each team might have an alertmanager configuration file fragment
which they fully control, that are then combined into the full final
configuration file.
Prometheus
Prometheus не устанавливается из репозитория и имеет, относительно, сложный процесс установки. Необходимо скачать исходник, создать пользователя, вручную скопировать нужные файлы, назначить права и создать юнит для автозапуска.
Загрузка
Переходим на официальную страницу загрузки и копируем ссылку на пакет для Linux:
… и используем ее для загрузки пакета на Linux:
wget https://github.com/prometheus/prometheus/releases/download/v2.20.1/prometheus-2.20.1.linux-amd64.tar.gz
* если система вернет ошибку, необходимо установить пакет wget.
Установка (копирование файлов)
После того, как мы скачали архив prometheus, необходимо его распаковать и скопировать содержимое по разным каталогам.
Для начала создаем каталоги, в которые скопируем файлы для prometheus:
mkdir /etc/prometheus
mkdir /var/lib/prometheus
Распакуем наш архив:
tar zxvf prometheus-*.linux-amd64.tar.gz
… и перейдем в каталог с распакованными файлами:
cd prometheus-*.linux-amd64
Распределяем файлы по каталогам:
cp prometheus promtool /usr/local/bin/
cp -r console_libraries consoles prometheus.yml /etc/prometheus
Назначение прав
Создаем пользователя, от которого будем запускать систему мониторинга:
useradd —no-create-home —shell /bin/false prometheus
* мы создали пользователя prometheus без домашней директории и без возможности входа в консоль сервера.
Задаем владельца для каталогов, которые мы создали на предыдущем шаге:
chown -R prometheus:prometheus /etc/prometheus /var/lib/prometheus
Задаем владельца для скопированных файлов:
chown prometheus:prometheus /usr/local/bin/{prometheus,promtool}
Запуск и проверка
Запускаем prometheus командой:
/usr/local/bin/prometheus —config.file /etc/prometheus/prometheus.yml —storage.tsdb.path /var/lib/prometheus/ —web.console.templates=/etc/prometheus/consoles —web.console.libraries=/etc/prometheus/console_libraries
… мы увидим лог запуска — в конце «Server is ready to receive web requests»:
level=info ts=2019-08-07T07:39:06.849Z caller=main.go:621 msg=»Server is ready to receive web requests.»
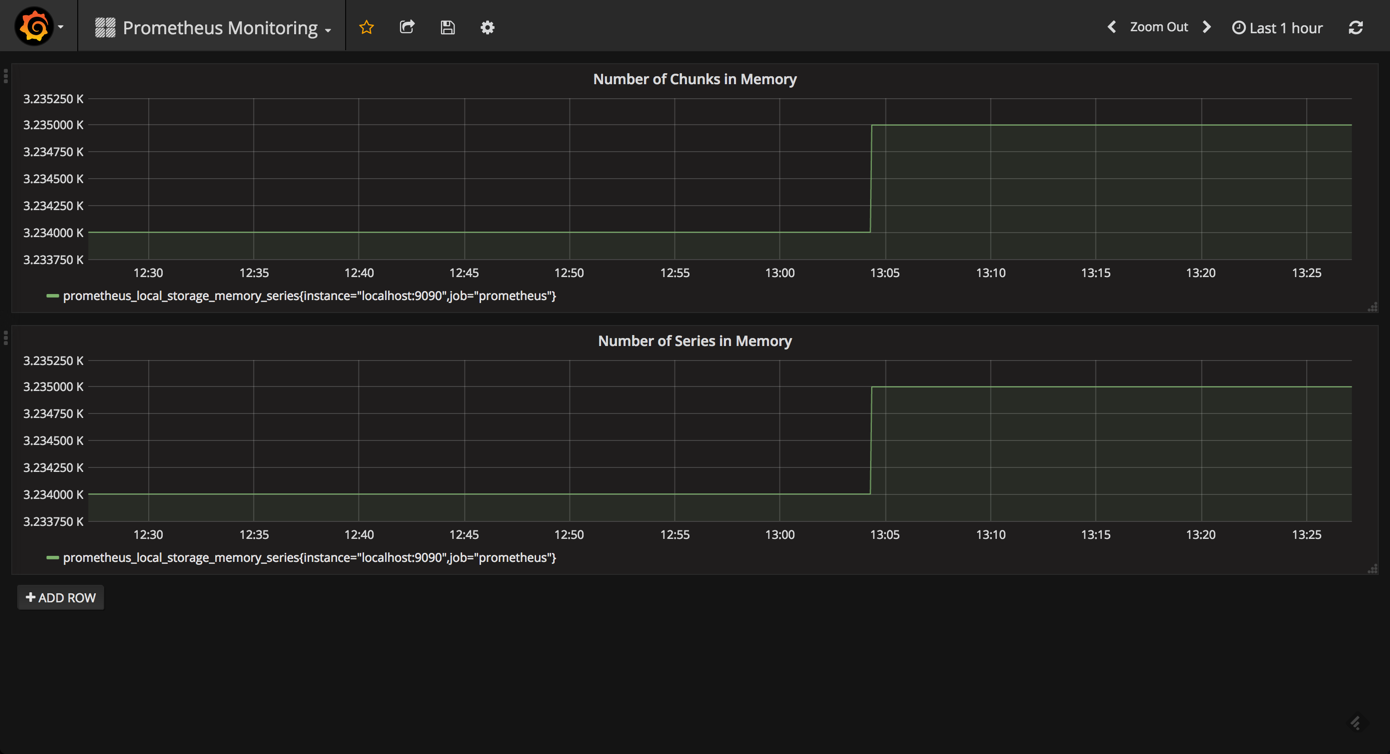
Открываем веб-браузер и переходим по адресу http://<IP-адрес сервера>:9090 — загрузится консоль Prometheus:
Установка завершена.
Автозапуск
Мы установили наш сервер мониторинга, но его необходимо запускать вручную, что совсем не подходит для серверных задач. Для настройки автоматического старта Prometheus мы создадим новый юнит в systemd.
Возвращаемся к консоли сервера и прерываем работу Prometheus с помощью комбинации Ctrl + C. Создаем файл prometheus.service:
vi /etc/systemd/system/prometheus.service
Description=Prometheus Service
After=network.target
User=prometheus
Group=prometheus
Type=simple
ExecStart=/usr/local/bin/prometheus \
—config.file /etc/prometheus/prometheus.yml \
—storage.tsdb.path /var/lib/prometheus/ \
—web.console.templates=/etc/prometheus/consoles \
—web.console.libraries=/etc/prometheus/console_libraries
ExecReload=/bin/kill -HUP $MAINPID
Restart=on-failure
WantedBy=multi-user.target
Перечитываем конфигурацию systemd:
systemctl daemon-reload
Разрешаем автозапуск:
systemctl enable prometheus
После ручного запуска мониторинга, который мы делали для проверки, могли сбиться права на папку библиотек — снова зададим ей владельца:
chown -R prometheus:prometheus /var/lib/prometheus
Запускаем службу:
systemctl start prometheus
… и проверяем, что она запустилась корректно:
systemctl status prometheus
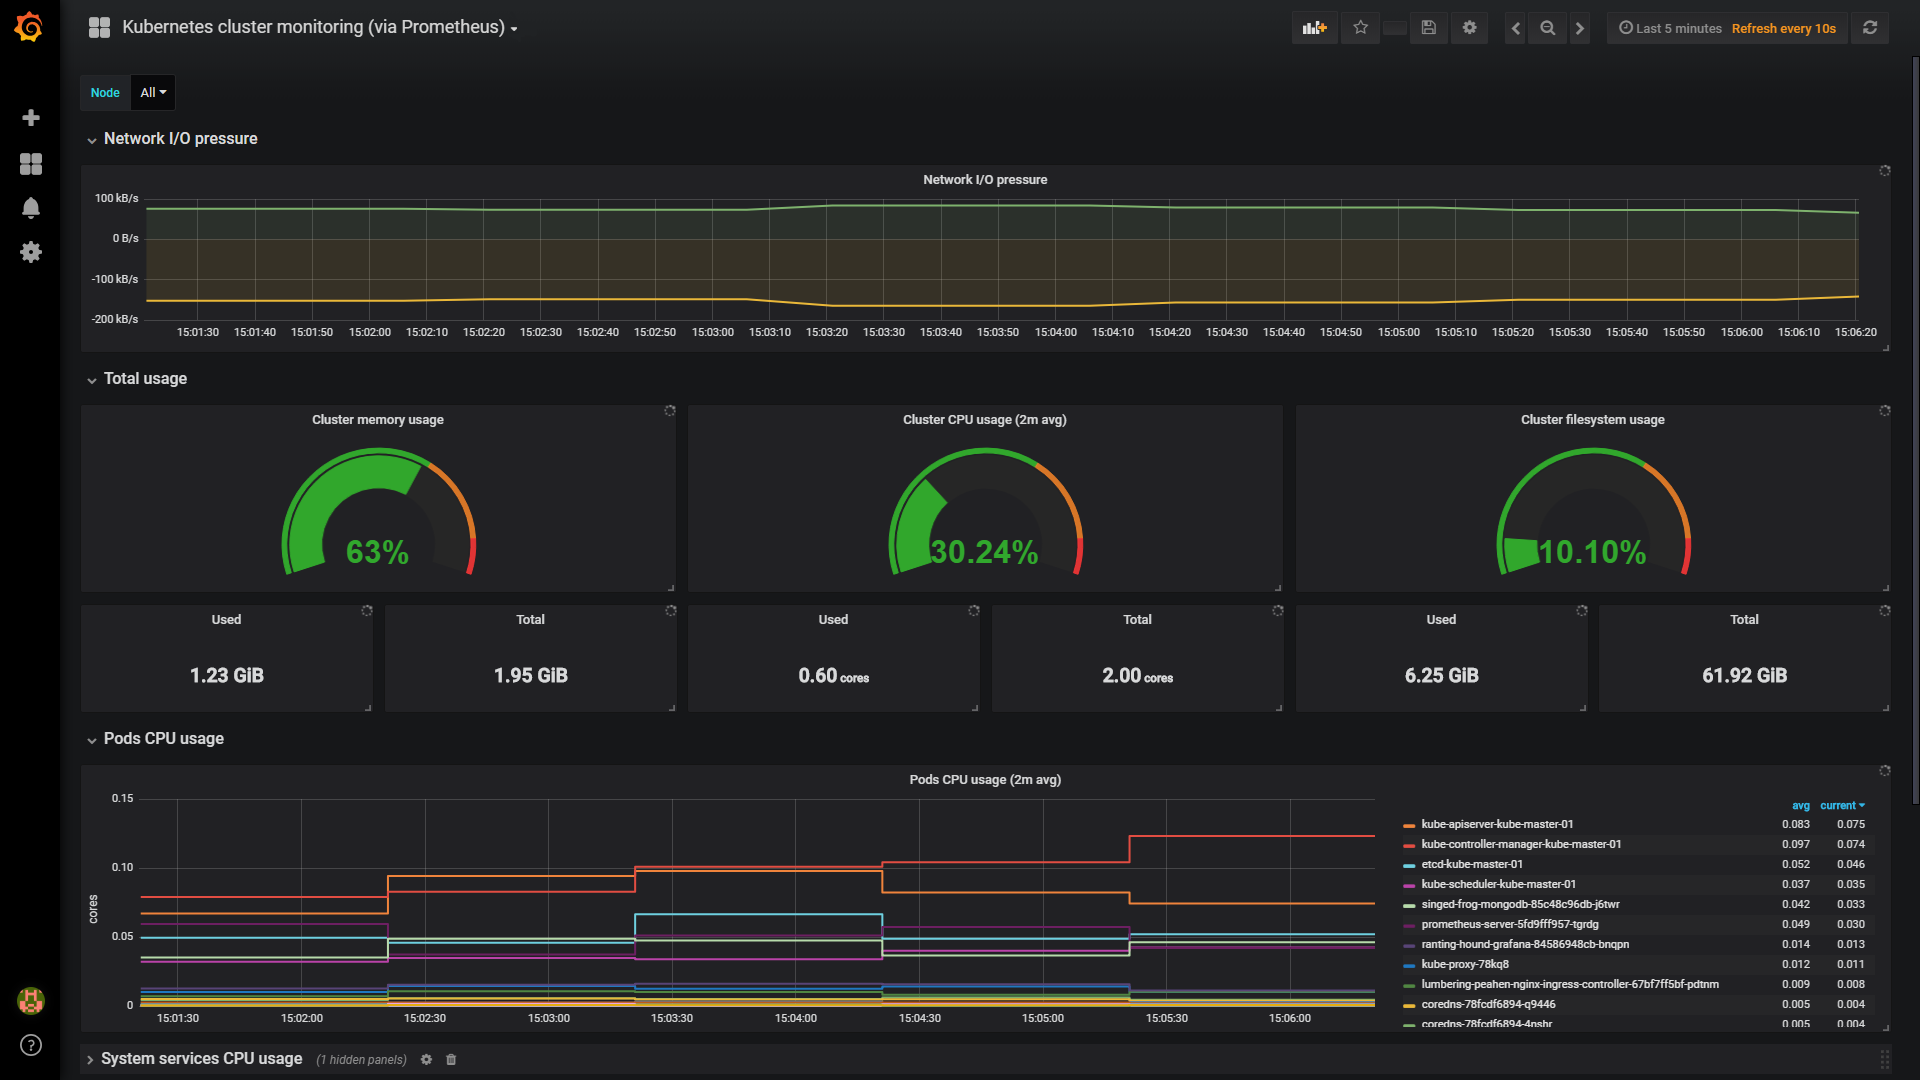
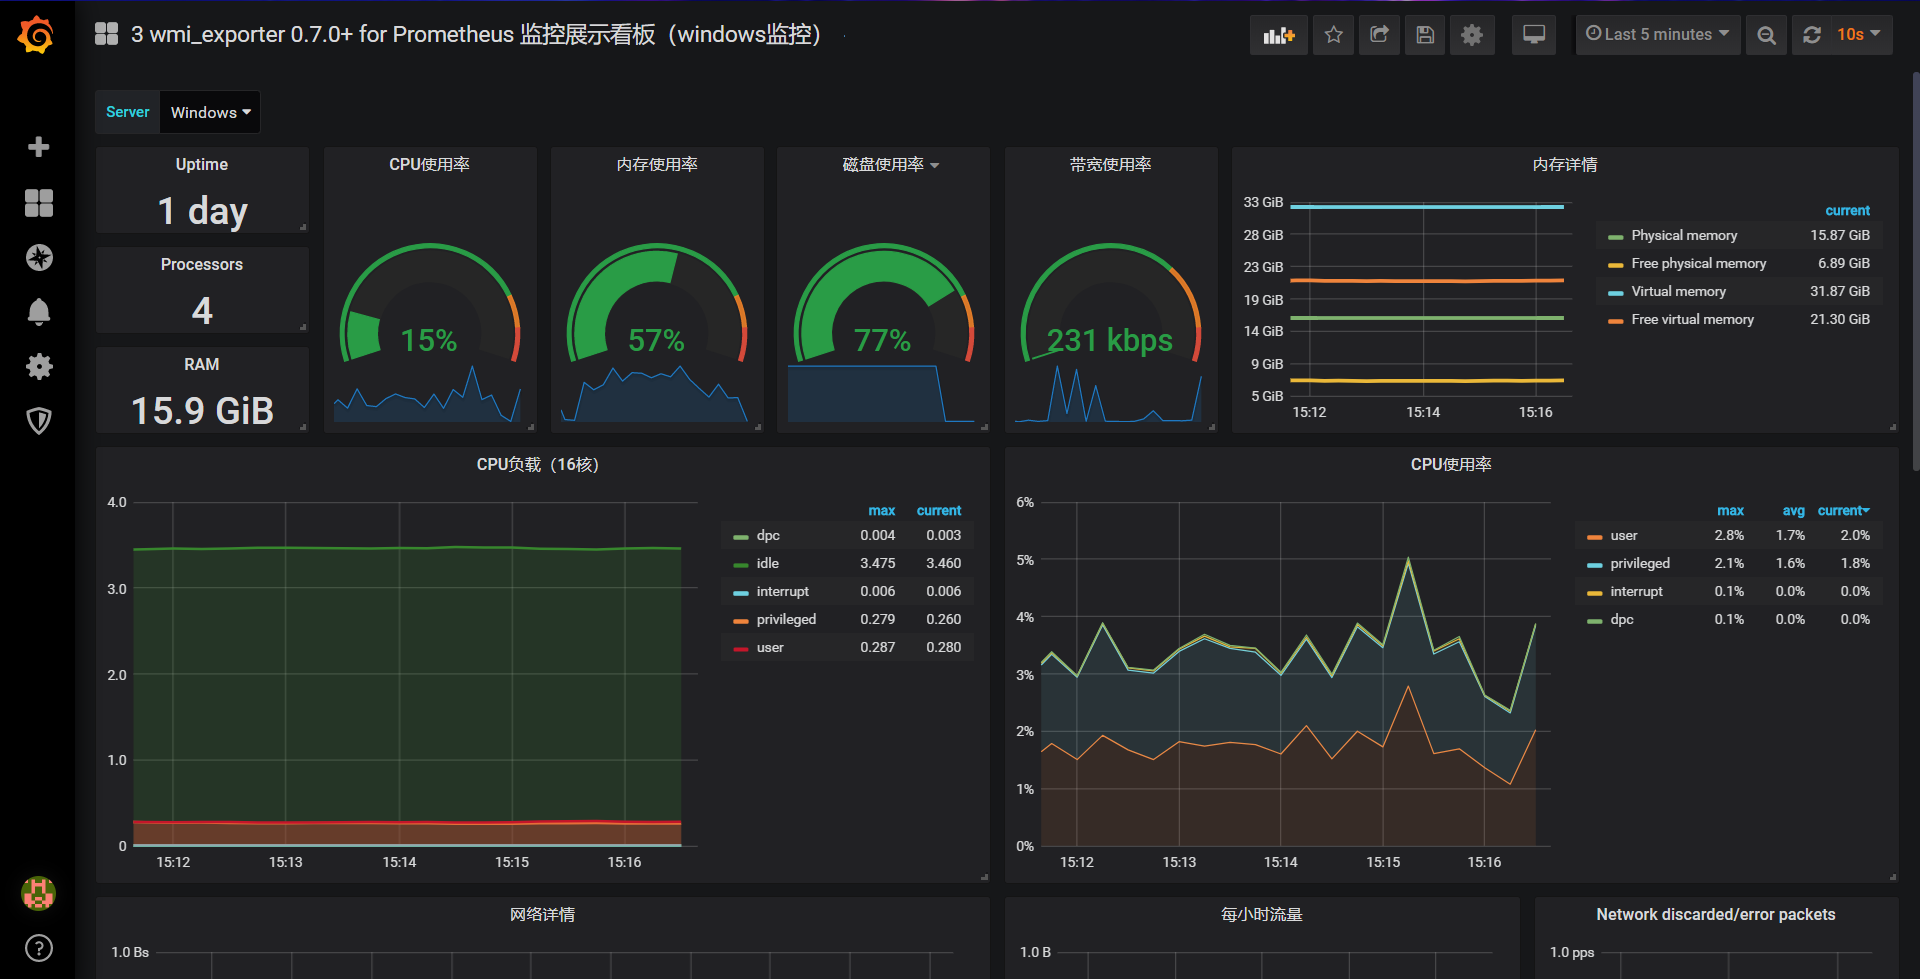
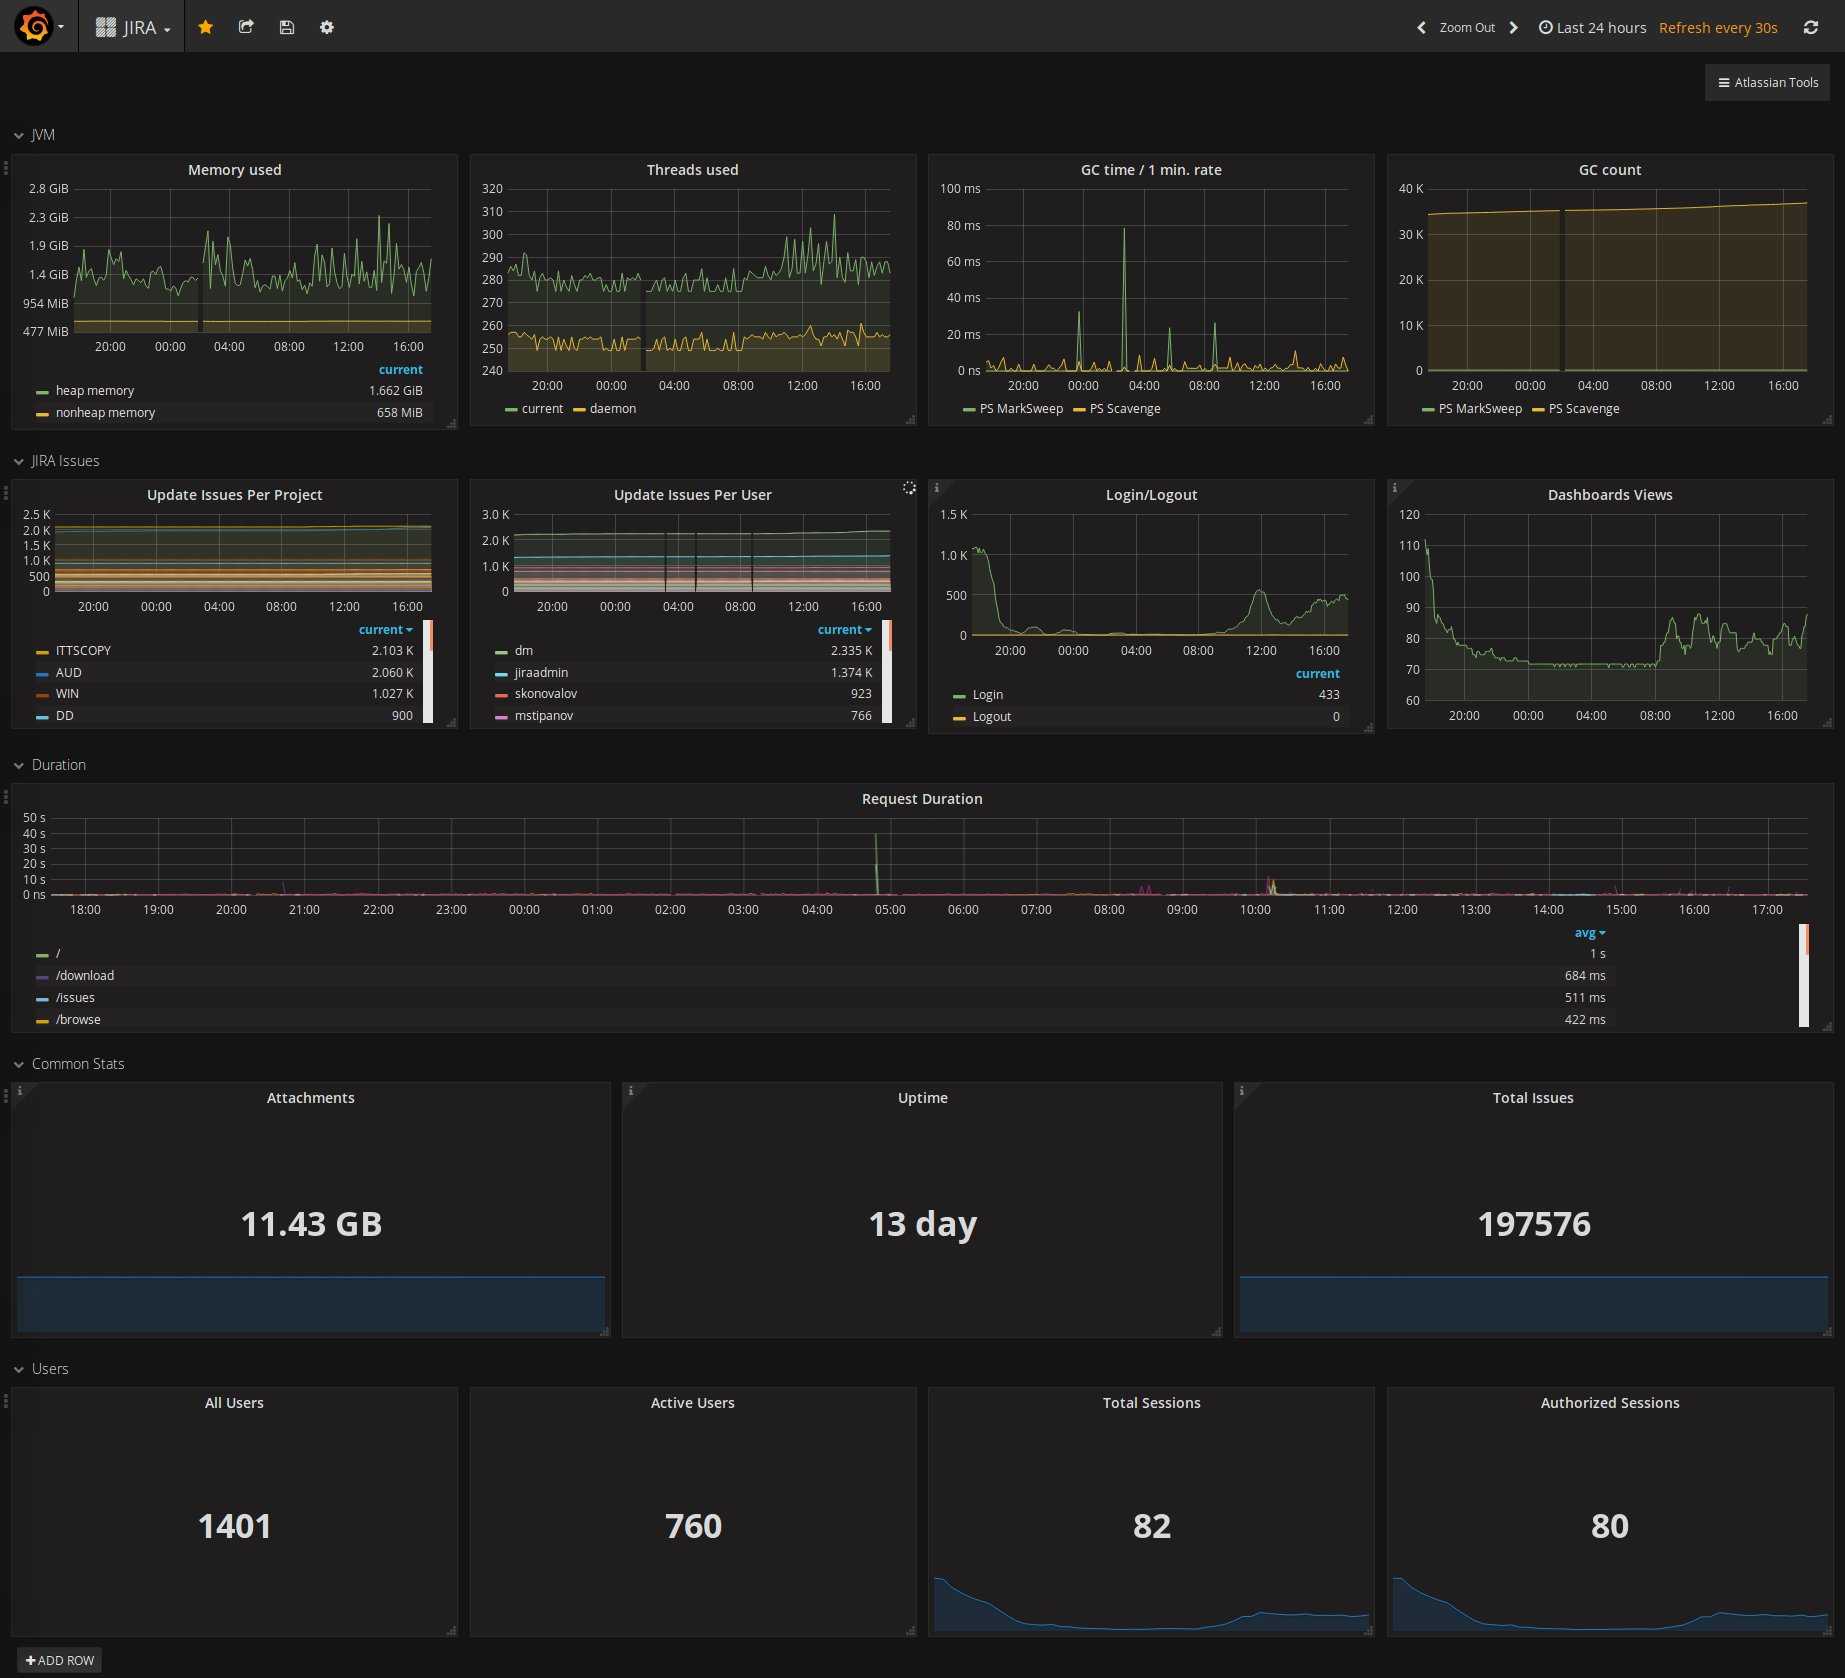
Мониторинг служб Linux
Для мониторинга сервисов с помощью Prometheus мы настроим сбор метрик и отображение тревог.
Сбор метрие с помощью node_exporter
Открываем сервис, созданный для node_exporter:
vi /etc/systemd/system/node_exporter.service
… и добавим к ExecStart:
…
ExecStart=/usr/local/bin/node_exporter —collector.systemd
…
* данная опция указывает экспортеру мониторить состояние каждой службы.
При необходимости, мы можем либо мониторить отдельные службы, добавив опцию collector.systemd.unit-whitelist:
ExecStart=/usr/local/bin/node_exporter —collector.systemd —collector.systemd.unit-whitelist=»(chronyd|mariadb|nginx).service»
* в данном примере будут мониториться только сервисы chronyd, mariadb и nginx.
… либо наоборот — мониторить все службы, кроме отдельно взятых:
ExecStart=/usr/local/bin/node_exporter —collector.systemd —collector.systemd.unit-blacklist=»(auditd|dbus|kdump).service»
* при такой настройке мы запретим мониторинг сервисов auditd, dbus и kdump.
Чтобы применить настройки, перечитываем конфиг systemd:
systemctl daemon-reload
Перезапускаем node_exporter:
systemctl restart node_exporter
Отображение тревог
Настроим мониторинг для службы NGINX.
Создаем файл с правилом:
vi /etc/prometheus/services.rules.yml
groups:
— name: services.rules
rules:
— alert: nginx_service
expr: node_systemd_unit_state{name=»nginx.service»,state=»active»} == 0
for: 1s
annotations:
summary: «Instance {{ $labels.instance }} is down»
description: «{{ $labels.instance }} of job {{ $labels.job }} is down.»
Подключим файл с описанием правил в конфигурационном файле prometheus:
vi /etc/prometheus/prometheus.yml
…
rule_files:
# — «first_rules.yml»
# — «second_rules.yml»
— «alert.rules.yml»
— «services.rules.yml»
…
* в данном примере мы добавили наш файл services.rules.yml к уже ранее добавленному alert.rules.yml в секцию rule_files.
Перезапускаем prometheus:
systemctl restart prometheus
Для проверки, остановим наш сервис:
systemctl stop nginx
В консоли Prometheus в разделе Alerts мы должны увидеть тревогу:
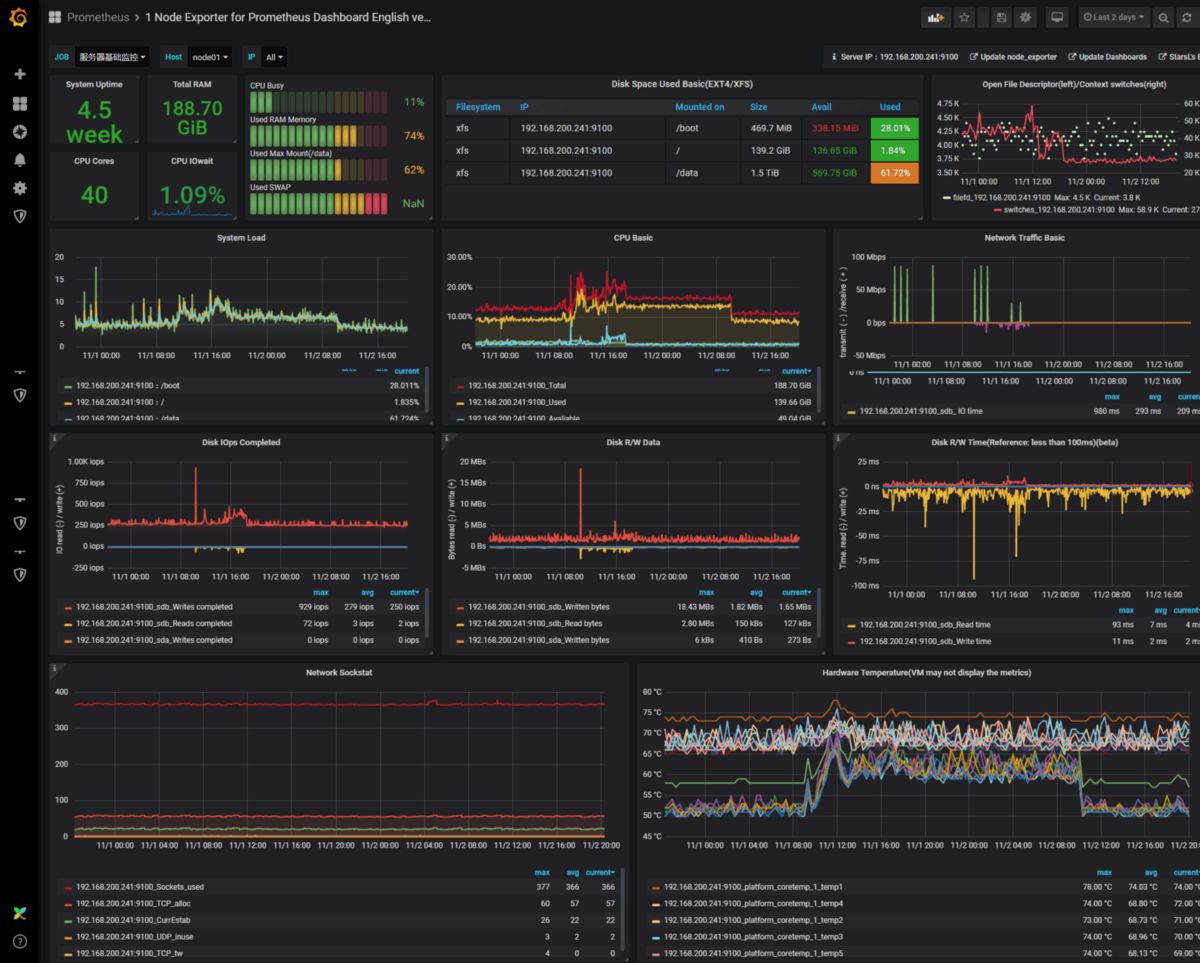
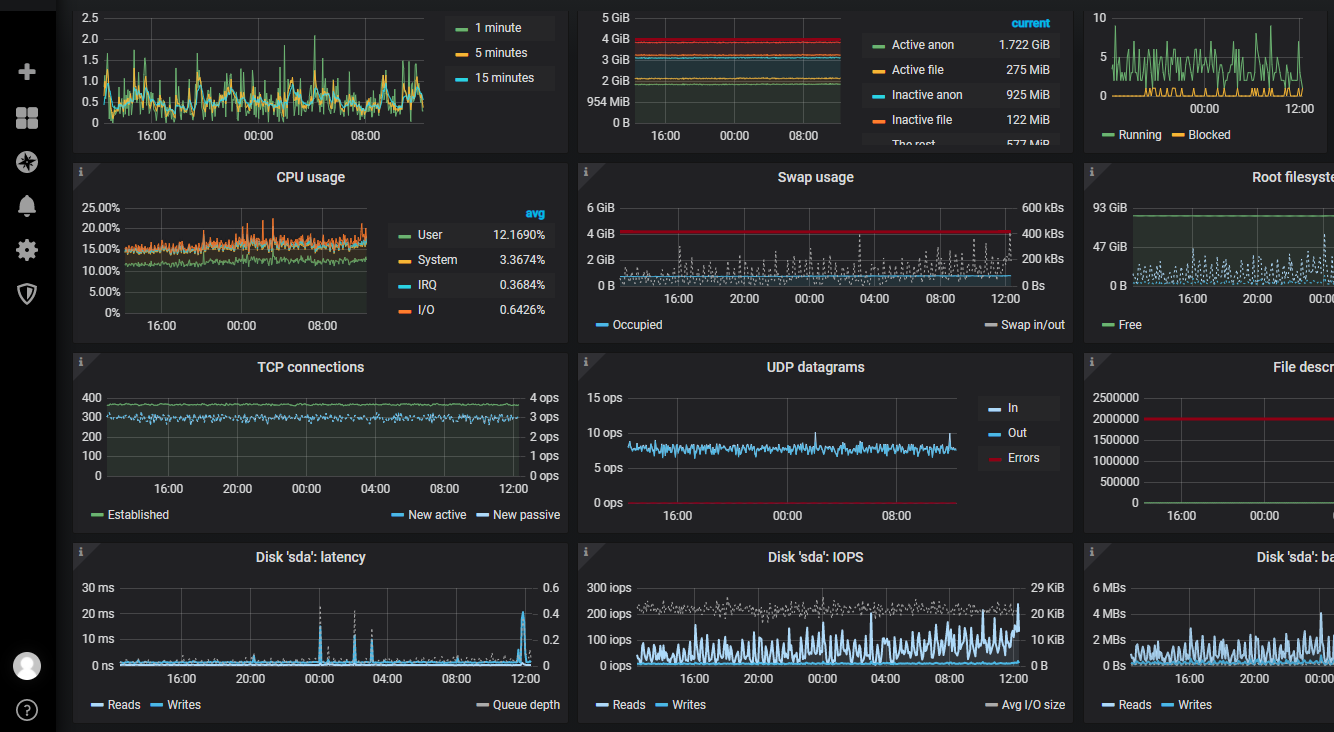
Exporters
prometheus-node-exporter
- В Debian ставится как зависимость к пакету prometheus и добавлен в конфигурацию
Примеры счетчиков
node_filesystem_free_bytes
$ df /
...
/dev/mapper/debian--vg-root  15662008 1877488  12969212  13% /
...
# TYPE node_filesystem_free_bytes gauge
node_filesystem_free_bytes{device="/dev/mapper/debian--vg-root",fstype="ext4",mountpoint="/"} = (15662008 - 1877488) * 1024
node_network_receive_bytes_total
$ cat /sys/class/net/eth1/statistics/rx_bytes

# TYPE node_network_receive_bytes_total counter
node_network_receive_bytes_total{device="eth1"}
Подключение к prometheus
# less /etc/prometheus/prometheus.yml
...
  - job_name: node
    # If prometheus-node-exporter is installed, grab stats about the local
    # machine by default.
    static_configs:
      - targets:
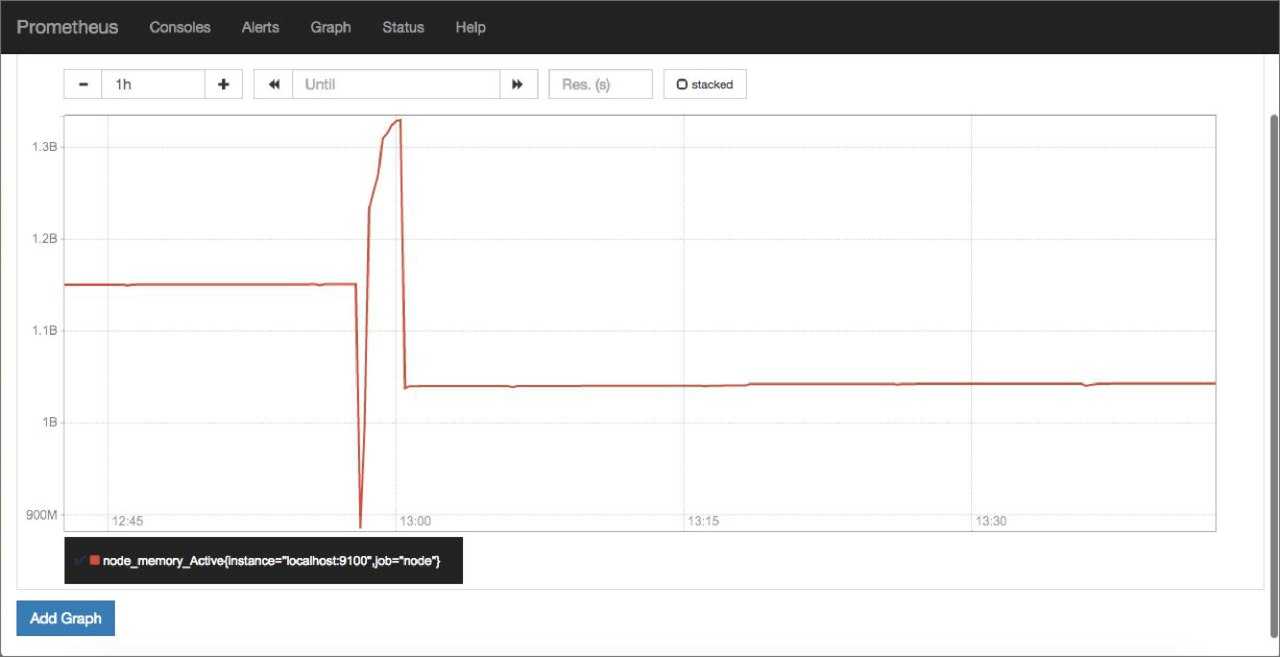
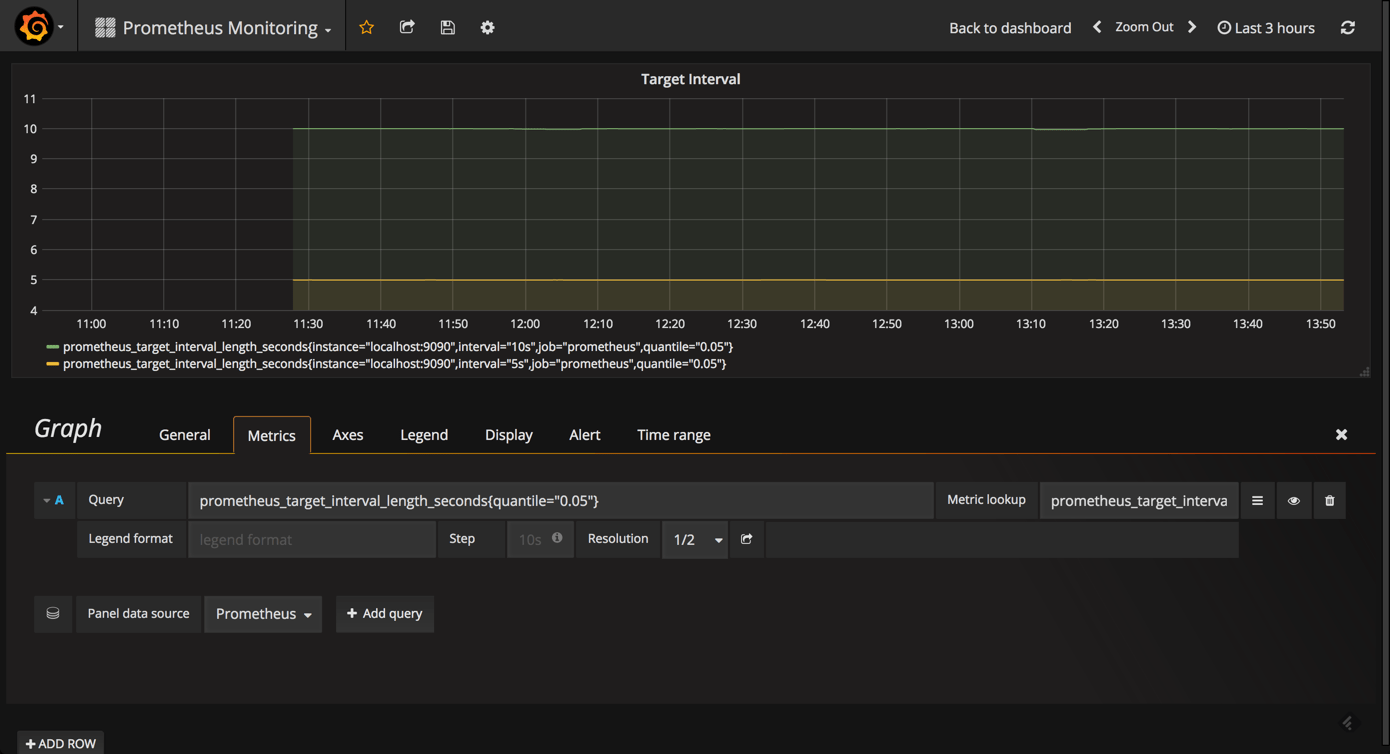
Запросы PromQL
8*rate(node_network_receive_bytes_total)

8*rate(node_network_receive_bytes_total{device="eth1"})

8*rate(node_network_receive_bytes_total{device="eth1",instance="localhost:9100",job="node"})
prometheus-blackbox-exporter
# apt install prometheus-blackbox-exporter
Пример конфигурации
# cat /etc/prometheus/blackbox.yml
...
  http_2xx:
    prober: http
    http:
      preferred_ip_protocol: "ip4"
...
# service prometheus-blackbox-exporter restart

# cat /etc/prometheus/prometheus.yml
...
  - job_name: check_http
    metrics_path: /probe
    params:
      module:
    static_configs:
      - targets:
        - https://google.com
        - https://ya.ru
    relabel_configs:
      - source_labels:
        target_label: __param_target
      - source_labels:
        target_label: instance
      - target_label: __address__
        replacement: localhost:9115

  - job_name: check_ssh
    metrics_path: /probe
    params:
      module:
    static_configs:
      - targets:
        - switch1:22
        - switch2:22
        - switch3:22
    relabel_configs:
      - source_labels:
        target_label: __param_target
      - source_labels:
        target_label: instance
      - target_label: __address__
        replacement: localhost:9115
probe_success...

probe_duration_seconds...

probe_http_duration_seconds...
Пример использования file-based service discovery и сервиса ping
# cat /etc/prometheus/prometheus.yml
...
  - job_name: check_ping
    metrics_path: /probe
    params:
      module:
    file_sd_configs:
      - files:
#        - switchs.yml
#        - switchs.json
    relabel_configs:
      - source_labels:
        target_label: __param_target
      - source_labels:
        target_label: instance
      - target_label: __address__
        replacement: localhost:9115
# cat /etc/prometheus/switchs.json
  }
]
# cat /etc/prometheus/switchs.yml
- targets:
  - switch1
  - switch2
  - switch3
Проверка конфигурации и перезапуск
prometheus-snmp-exporter
# apt install prometheus-snmp-exporter

# cat /etc/prometheus/snmp.yml
#if_mib:   # по умолчанию, позволяет не указывать module в http запросе
snmp_in_out_octets:
  version: 2
  auth:
    community: public
  walk:
  - 1.3.6.1.2.1.2.2.1.10
  - 1.3.6.1.2.1.2.2.1.16
  - 1.3.6.1.2.1.2.2.1.2
  metrics:
  - name: if_in_octets
    oid: 1.3.6.1.2.1.2.2.1.10
    type: counter
    indexes:
    - labelname: ifIndex
      type: Integer
    lookups:
    - labels:
      - ifIndex
      labelname: ifDescr
      oid: 1.3.6.1.2.1.2.2.1.2
      type: DisplayString
  - name: if_out_octets
    oid: 1.3.6.1.2.1.2.2.1.16
    type: counter
    indexes:
    - labelname: ifIndex
      type: Integer
    lookups:
    - labels:
      - ifIndex
      labelname: ifDescr
      oid: 1.3.6.1.2.1.2.2.1.2
      type: DisplayString
# service prometheus-snmp-exporter restart
http://server.corpX.un:9116/
# curl --noproxy 127.0.0.1 'http://127.0.0.1:9116/snmp?target=router&module=snmp_in_out_octets'
# cat /etc/prometheus/prometheus.yml
...
  - job_name: 'snmp'
    static_configs:
      - targets:
        - router
    metrics_path: /snmp
    params:
      module:
    relabel_configs:
      - source_labels:
        target_label: __param_target
      - source_labels:
        target_label: instance
      - target_label: __address__
        replacement: localhost:9116
Проверка конфигурации и перезапуск
rate(if_in_octets{ifDescr="FastEthernet1/1",ifIndex="3",instance="router",job="snmp"})

8*rate(if_in_octets{ifDescr="FastEthernet1/1",instance="router"})
Exporters
prometheus-node-exporter
- В Debian ставится как зависимость к пакету prometheus и добавлен в конфигурацию
Примеры счетчиков
node_filesystem_free_bytes
$ df /
...
/dev/mapper/debian--vg-root  15662008 1877488  12969212  13% /
...
# TYPE node_filesystem_free_bytes gauge
node_filesystem_free_bytes{device="/dev/mapper/debian--vg-root",fstype="ext4",mountpoint="/"} = (15662008 - 1877488) * 1024
node_network_receive_bytes_total
$ cat /sys/class/net/eth1/statistics/rx_bytes

# TYPE node_network_receive_bytes_total counter
node_network_receive_bytes_total{device="eth1"}
Подключение к prometheus
# less /etc/prometheus/prometheus.yml
...
  - job_name: node
    # If prometheus-node-exporter is installed, grab stats about the local
    # machine by default.
    static_configs:
      - targets:
Запросы PromQL
8*rate(node_network_receive_bytes_total)

8*rate(node_network_receive_bytes_total{device="eth1"})

8*rate(node_network_receive_bytes_total{device="eth1",instance="localhost:9100",job="node"})
prometheus-blackbox-exporter
# apt install prometheus-blackbox-exporter
Пример конфигурации
# cat /etc/prometheus/blackbox.yml
...
  http_2xx:
    prober: http
    http:
      preferred_ip_protocol: "ip4"
...
# service prometheus-blackbox-exporter restart

# cat /etc/prometheus/prometheus.yml
...
  - job_name: check_http
    metrics_path: /probe
    params:
      module:
    static_configs:
      - targets:
        - https://google.com
        - https://ya.ru
    relabel_configs:
      - source_labels:
        target_label: __param_target
      - source_labels:
        target_label: instance
      - target_label: __address__
        replacement: localhost:9115

  - job_name: check_ssh
    metrics_path: /probe
    params:
      module:
    static_configs:
      - targets:
        - switch1:22
        - switch2:22
        - switch3:22
    relabel_configs:
      - source_labels:
        target_label: __param_target
      - source_labels:
        target_label: instance
      - target_label: __address__
        replacement: localhost:9115
probe_success...

probe_duration_seconds...

probe_http_duration_seconds...
Пример использования file-based service discovery и сервиса ping
# cat /etc/prometheus/prometheus.yml
...
  - job_name: check_ping
    metrics_path: /probe
    params:
      module:
    file_sd_configs:
      - files:
#        - switchs.yml
#        - switchs.json
    relabel_configs:
      - source_labels:
        target_label: __param_target
      - source_labels:
        target_label: instance
      - target_label: __address__
        replacement: localhost:9115
# cat /etc/prometheus/switchs.json
  }
]
# cat /etc/prometheus/switchs.yml
- targets:
  - switch1
  - switch2
  - switch3
Проверка конфигурации и перезапуск
prometheus-snmp-exporter
# apt install prometheus-snmp-exporter

# cat /etc/prometheus/snmp.yml
#if_mib:   # по умолчанию, позволяет не указывать module в http запросе
snmp_in_out_octets:
  version: 2
  auth:
    community: public
  walk:
  - 1.3.6.1.2.1.2.2.1.10
  - 1.3.6.1.2.1.2.2.1.16
  - 1.3.6.1.2.1.2.2.1.2
  metrics:
  - name: if_in_octets
    oid: 1.3.6.1.2.1.2.2.1.10
    type: counter
    indexes:
    - labelname: ifIndex
      type: Integer
    lookups:
    - labels:
      - ifIndex
      labelname: ifDescr
      oid: 1.3.6.1.2.1.2.2.1.2
      type: DisplayString
  - name: if_out_octets
    oid: 1.3.6.1.2.1.2.2.1.16
    type: counter
    indexes:
    - labelname: ifIndex
      type: Integer
    lookups:
    - labels:
      - ifIndex
      labelname: ifDescr
      oid: 1.3.6.1.2.1.2.2.1.2
      type: DisplayString
# service prometheus-snmp-exporter restart
http://server.corpX.un:9116/
# curl --noproxy 127.0.0.1 'http://127.0.0.1:9116/snmp?target=router&module=snmp_in_out_octets'
# cat /etc/prometheus/prometheus.yml
...
  - job_name: 'snmp'
    static_configs:
      - targets:
        - router
    metrics_path: /snmp
    params:
      module:
    relabel_configs:
      - source_labels:
        target_label: __param_target
      - source_labels:
        target_label: instance
      - target_label: __address__
        replacement: localhost:9116
Проверка конфигурации и перезапуск
rate(if_in_octets{ifDescr="FastEthernet1/1",ifIndex="3",instance="router",job="snmp"})

8*rate(if_in_octets{ifDescr="FastEthernet1/1",instance="router"})
prometheus-alertmanager
# apt install prometheus-alertmanager

# cat /etc/prometheus/alertmanager.yml
...
global:
  smtp_smarthost: 'localhost:25'
  smtp_from: 'prometheus@server.corpX.un'
  smtp_require_tls: false
#  smtp_auth_username: 'alertmanager'
#  smtp_auth_password: 'password'
...
  # A default receiver
  receiver: team-X-mails
...
receivers:
- name: 'team-X-mails'
  email_configs:
#  - to: 'student@corpX.un'
#  - to: 'userX@isp.un'
    send_resolved: true
...
# service prometheus-alertmanager restart

# cat /etc/prometheus/first_rules.yml
groups:
- name: alert.rules
  rules:
  - alert: InstanceDown
    expr: up == 0
    for: 1m
    labels:
      severity: "critical"
    annotations:
      summary: "Endpoint {{ $labels.instance }} down"
      description: "{{ $labels.instance }} of job {{ $labels.job }} has been down for more than 1 minutes."

  - alert: EndpointDown
    expr: probe_success == 0
    for: 1m
    labels:
      severity: "critical"
    annotations:
      summary: "Endpoint {{ $labels.instance }} down"

  - alert: CriticalTraffic
    expr: rate(if_in_octets{instance="router"})>125000
    for: 1m
    labels:
      severity: "critical"
    annotations:
      summary: "CriticalTraffic {{ $labels.instance }}"
# cat /etc/prometheus/prometheus.yml
...
# Alertmanager configuration
alerting:
  alertmanagers:
  - static_configs:
    - targets:

# Load rules once and periodically evaluate them according to the global 'evaluation_interval'.
rule_files:
  - "first_rules.yml"
  # - "second_rules.yml"

...
Проверка конфигурации и перезапуск
...
Checking /etc/prometheus/first_rules.yml
  SUCCESS: N rules found
...
http://server.corpX.un:9090/alerts
Отправка уведомлений
Теперь настроим связку с алерт менеджером для отправки уведомлений на почту.
Настроим alertmanager:
vi /etc/alertmanager/alertmanager.yml
В секцию global добавим:
global:
…
smtp_from: monitoring@dmosk.ru
Приведем секцию route к виду:
… далее добавим еще один ресивер:

* в данном примере мы отправляем сообщение на почтовый ящик alert@dmosk.ru с локального сервера
Обратите внимание, что для отправки почты наружу у нас должен быть корректно настроенный почтовый сервер (в противном случае, почта может попадать в СПАМ)
Перезапустим сервис для алерт менеджера:
systemctl restart alertmanager
Теперь настроим связку prometheus с alertmanager — открываем конфигурационный файл сервера мониторинга:
vi /etc/prometheus/prometheus.yml
Приведем секцию alerting к виду:
alerting:
alertmanagers:
— static_configs:
— targets:
— 192.168.0.14:9093
* где 192.168.0.14 — IP-адрес сервера, на котором у нас стоит alertmanager.
Перезапускаем сервис:
systemctl restart prometheus
Немного ждем и заходим на веб интерфейс алерт менеджера — мы должны увидеть тревогу:
… а на почтовый ящик должно прийти письмо с тревогой.
prometheus-alertmanager
# apt install prometheus-alertmanager

# cat /etc/prometheus/alertmanager.yml
...
global:
  smtp_smarthost: 'localhost:25'
  smtp_from: 'prometheus@server.corpX.un'
  smtp_require_tls: false
#  smtp_auth_username: 'alertmanager'
#  smtp_auth_password: 'password'
...
  # A default receiver
  receiver: team-X-mails
...
receivers:
- name: 'team-X-mails'
  email_configs:
#  - to: 'student@corpX.un'
#  - to: 'userX@isp.un'
    send_resolved: true
...
# service prometheus-alertmanager restart

# cat /etc/prometheus/first_rules.yml
groups:
- name: alert.rules
  rules:
  - alert: InstanceDown
    expr: up == 0
    for: 1m
    labels:
      severity: "critical"
    annotations:
      summary: "Endpoint {{ $labels.instance }} down"
      description: "{{ $labels.instance }} of job {{ $labels.job }} has been down for more than 1 minutes."

  - alert: EndpointDown
    expr: probe_success == 0
    for: 1m
    labels:
      severity: "critical"
    annotations:
      summary: "Endpoint {{ $labels.instance }} down"

  - alert: CriticalTraffic
    expr: rate(if_in_octets{instance="router"})>125000
    for: 1m
    labels:
      severity: "critical"
    annotations:
      summary: "CriticalTraffic {{ $labels.instance }}"
# cat /etc/prometheus/prometheus.yml
...
# Alertmanager configuration
alerting:
  alertmanagers:
  - static_configs:
    - targets:

# Load rules once and periodically evaluate them according to the global 'evaluation_interval'.
rule_files:
  - "first_rules.yml"
  # - "second_rules.yml"

...
Проверка конфигурации и перезапуск
...
Checking /etc/prometheus/first_rules.yml
  SUCCESS: N rules found
...
http://server.corpX.un:9090/alerts
API Security
As administrative and mutating endpoints are intended to be accessed via simple
tools such as cURL, there is no built in
CSRF protection as
that would break such use cases. Accordingly when using a reverse proxy, you
may wish to block such paths to prevent CSRF.
For non-mutating endpoints, you may wish to set such as
in your reverse proxy to prevent
XSS.
If you are composing PromQL queries that include input from untrusted users
(e.g. URL parameters to console templates, or something you built yourself) who
are not meant to be able to run arbitrary PromQL queries make sure any
untrusted input is appropriately escaped to prevent injection attacks. For
example would become if the was .
For those using Grafana note that ,
so do not limit a user’s ability to run arbitrary queries in proxy mode.