Настройка MySQL / MariaDB server
От правильной настройки MySQL / MariaDB зависит насколько быстро будет работать ваш сервер / сайт. Все, что вы делали раньше может “превратиться в тыкву” если оставить параметры по умолчанию. Настройки mysql можно найти в /etc/mysql/my.cnf. Перед тем как вы будете создавать базы данных или переносить существующие стоит выполнить несколько простых действий:
- Решите какой “движок” будет по умолчанию. Если у вас таблицы MyISAM, возможно стоит перейти на Aria, но лучше использовать InnoDB.
- Установите последнюю версию MySQL / MariaDB
- Отредактируйте /etc/mysql/my.cnf:
Данные параметры оптимальны для VPS с 3 гб оперативной памяти и двумя CPU. Для серверов с большим количеством оперативной памяти и CPU некоторые значения стоит изменить. Если используются NVMe диски то можно включить задокументированные параметры.
Нам осталось только изменить (увеличить) приоритет mysql и увеличить лимит на открытие файлов. Раньше это можно было сделать параметром nice и open_file_limits в my.cnf. В новых версиях это не работает.
Часть настроек теперь находится в /lib/systemd/system/. Отредактируйте файлы mariadb.service и mariadb@.service:
Проблема настроек SQL server
Это тот самый случай, когда сделали (перенесли настройки), а задокументировать забыли… Вот все и гадают, почему nice или не работает, или вызывает ошибку при запуске сервера БД.
Сохраните и перезапустите systemd:
Не знаю, баг это или фича, но настройки сбрасываются “по умолчанию” после обновления SQL сервера. Так что будьте внимательны.
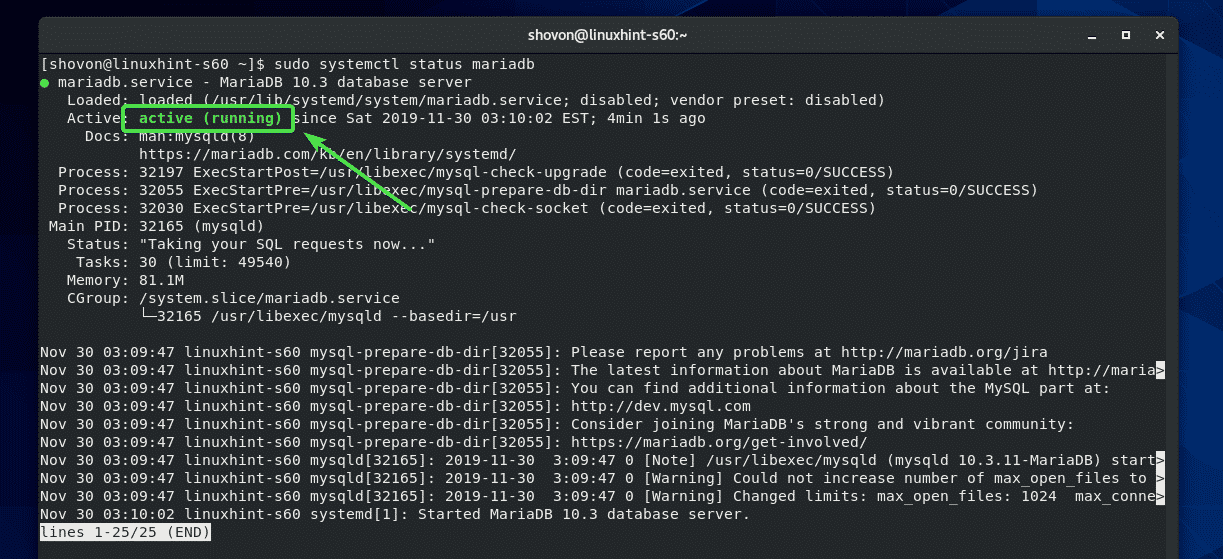
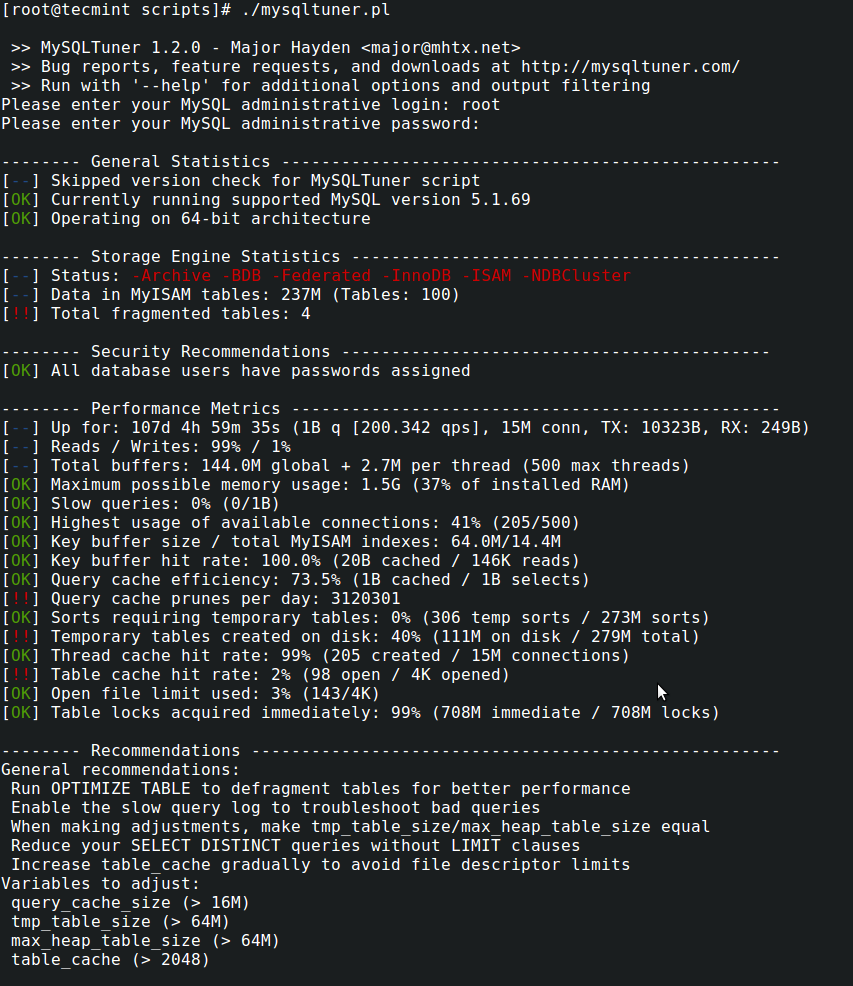
В идеале, если вы все сделали правильно, mysqltuner должен выдавать вот такую информацию:
Есть полная уверенность в том, что сервер баз данных работает максимально производительно. При этом он очень экономно расходует ресурсы, при этом не нагружая дисковую подсистему, память и процессор.
Ротация логов MariaDB
Откроем необходимый файл и сделаем необходимые изменения:
vim /etc/logrotate.d/mysql
= часть вывода с необходимыми изменениями =
/var/lib/mysql/*log {
        # create 600 mysql mysql
        notifempty
        daily
        size 5M
        rotate 7
        missingok
        compress
    postrotate
        # just if mysqld is really running
        if test -x /usr/bin/mysqladmin && \
           /usr/bin/mysqladmin ping &>/dev/null
        then
           /usr/bin/mysqladmin --local flush-error-log \
              flush-engine-log flush-general-log flush-slow-log
        fi
    endscript
}
Мы указали что надо ротировать все логи и хранить 7 дней при условии что размер файла 5 Mегабайт.
Сохраним и применим изменения без перезагрузки:
logrotate /etc/logrotate.conf
Проверим правильность выполнив тестирование (опция -d):
logrotate -d /etc/logrotate.d/mysql
= вывод команды =
reading config file /etc/logrotate.d/mysql
Allocating hash table for state file, size 15360 B

Handling 1 logs

rotating pattern: /var/lib/mysql/*log  5242880 bytes (7 rotations)
empty log files are not rotated, old logs are removed
considering log /var/lib/mysql/mysql_error.log
  log does not need rotating (log size is below the 'size' threshold)
considering log /var/lib/mysql/slow_queries.log
  log does not need rotating (log size is below the 'size' threshold)
considering log /var/lib/mysql/tc.log
  log does not need rotating (log size is below the 'size' threshold)
Все логи не имеют необходимого размера для выполнения ротации.
Set MySQL Query Cache Size no larger than 100 to 200MB!
A MySQL query cache size of 200 megabytes may even be too large! The key is to start very small (maybe 10mb), then increase in small increments while trying to keep a high ratio of query cache hits and also a low amount of query cache low memory prunes. All of this without setting MySQL’s query cache size too large. Why? Because a query_cache_size of 4 gigabytes is a good example of how query caching cripples performance when trying to scale.
A large query cache size leads to significant performance degradation. This is because of cache overhead and locking. Cacheable queries take out an exclusive lock on MySQL’s query cache. In addition, any insert, update, delete, or other modifications to a table causes any relevant entries in the query cache to be flushed. This happens even when there’s free query cache space available. As a result, the larger the query cache, the more system time is used for locks, flushes, and overhead until cache management eventually negates any benefit of MySQL’s query cache. Instead, it begins to eat away at throughput.
On the 32GB server mentioned above, with MySQL Query Cache Size set to 4GB, there were 100’s, sometimes 1000’s of queries with status “Waiting for query cache lock”. This causes PHP-FPM spikes as they wait on MySQL. Reducing MySQL Query Cache to 100 megabytes and lowering “query_cache_min_res_unit” and “query_cache_limit” solved the severe locking issues. I could have disabled Query Cache completely, but with the new settings, there’s still a +70% hit rate. However, eventually, MySQL Query Cache was completely disabled on that 32GB server for improved performance (read on):
query_cache_type                = 0
query_cache_size                = 0
![]()
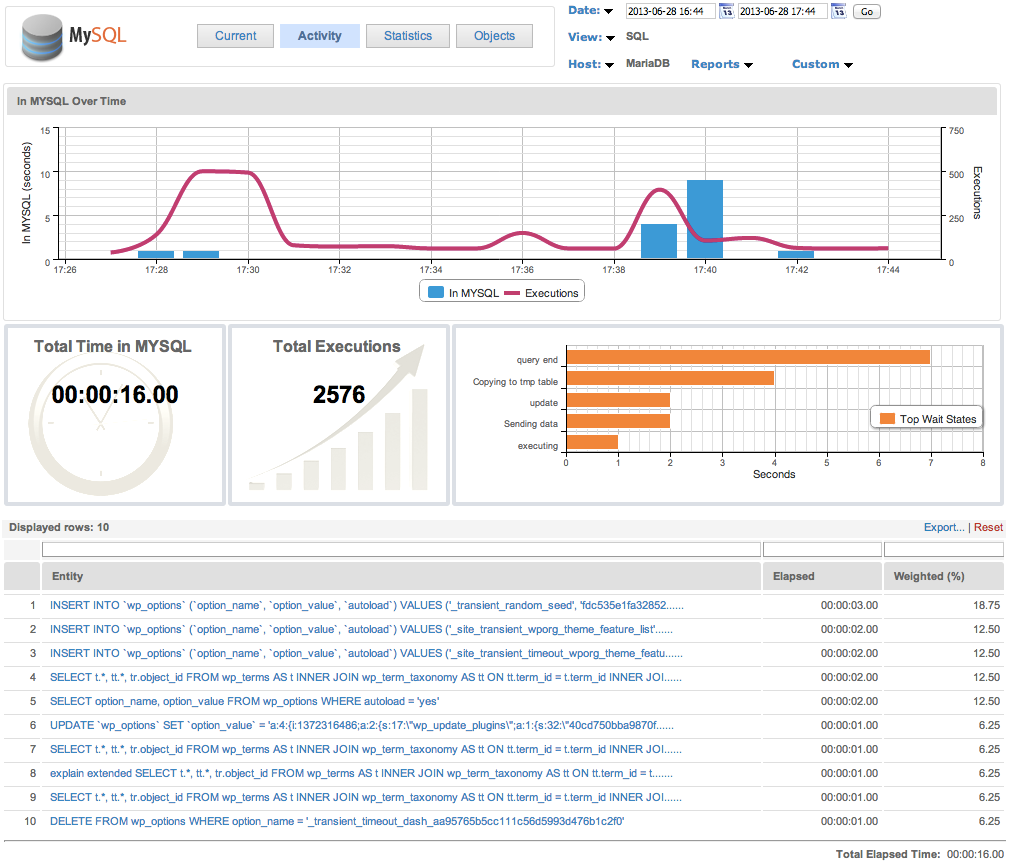
MySQL Query Cache monitor by Logicmonitor
Even with a nicely tuned query cache, there’s still around 10% to 15% overhead required to maintain it. So your query cache hit rate percentage ((Qcache_hits / (Qcache_hits + Qcache_inserts + Qcache_not_cached))*100) should be as close to 100% as possible. That being the percentage of queries served by cache instead of being re-executed by the database repeatedly. Of course, anything below 10% or 20% means your query cache is probably doing more harm to performance than good. Usually, I’ll keep query cache disabled if the hit rate is below 50% or… if prunes/purging rate is still high after increasing query cache size to a safe limit.
Изучение кэша запросов
Ряд переменных состояния предоставляют информацию о кэше запросов.
SHOW STATUS LIKE 'Qcache%';
+
| Variable_name           | Value    |
+
| Qcache_free_blocks      | 1158     |
| Qcache_free_memory      | 3760784  |
| Qcache_hits             | 31943398 |
| Qcache_inserts          | 42998029 |
| Qcache_lowmem_prunes    | 34695322 |
| Qcache_not_cached       | 652482   |
| Qcache_queries_in_cache | 4628     |
| Qcache_total_blocks     | 11123    |
+
содержит количество запросов, добавленных в кеш запросов, содержит количество запросов, которые использовали кеш запросов, а содержит количество запросов, которые были удалены из кеша из-за нехватки памяти.
Приведенный выше пример может указывать на плохо работающий кэш.Было добавлено больше запросов,и больше запросов было сброшено,чем использовалось на самом деле.
Обратите внимание, что до MariaDB 5.5 запросы, возвращаемые из кеша запросов, не увеличивали состояния Com_select , поэтому, чтобы найти общее количество допустимых запросов, запущенных на сервере, добавьте в. Начиная с MariaDB 5.5 , результаты, возвращаемые кешем запроса, учитываются в (см
MDEV-4981 ).
Плагин QUERY_CACHE_INFO создает QUERY_CACHE_INFO таблицу в INFORMATION_SCHEMA , что позволяет исследовать содержимое кэша запросов.
Запросы,хранящиеся в кэше запросов.
Если для системной переменной установлено значение или , все запросы, соответствующие ограничениям по размеру, будут храниться в кеше, если они не содержат предложение или не имеют кэширования по своей природе, например, с использованием функции который возвращает текущее время. Убедитесь, что заставит сервер не использовать блокировки кеша запросов.
![Недостаточно производительности сервера mysql [colobridge wiki]](https://myeditor.ru/wp-content/uploads/c/2/9/c295ba3544915ed8935e3a4acd383a9b.png)
Если в запросе присутствует какая-либо из следующих функций,то она не будет кэшироваться.Запросы с этими функциями иногда называют «недетерминистическими»-не путайте с использованием этого термина в других контекстах.
| BENCHMARK() | CONNECTION_ID() |
| CONVERT_TZ() | CURDATE() |
| CURRENT_DATE() | CURRENT_TIME() |
| CURRENT_TIMESTAMP() | CURTIME() |
| DATABASE() | ENCRYPT () (один параметр) |
| FOUND_ROWS() | GET_LOCK() |
| LAST_INSERT_ID() | LOAD_FILE() |
| MASTER_POS_WAIT() | NOW() |
| RAND() | RELEASE_LOCK() |
| SLEEP() | SYSDATE() |
| UNIX_TIMESTAMP () (без параметров) | USER() |
| UUID() | UUID_SHORT() |
Запрос также не будет добавлен в кэш if:
-
Он в форме:
- ВЫБРАТЬ SQL_NO_CACHE …
- ВЫБЕРИТЬ ……
- ВЫБРАТЬ …В ДАМПЕ …
- ВЫБЕРИТЬ …ДЛЯ ОБНОВЛЕНИЯ
- ВЫБРАТЬ*ИЗ …Где столбец autoincrement_column IS NULL
- ВЫБЕРИТЕ…РЕЖИМ СОВМЕСТНОГО ИСПОЛЬЗОВАНИЯ
- Он использует таблицу TEMPORY
- Он не использует столы вообще
- Он генерирует предупреждение
- Пользователь имеет привилегию на уровне столбцов на любой таблице в запросе.
- Она обращается к таблице из INFORMATION_SCHEMA,mysql или базы данных performance_schema.
- Использует пользовательские или локальные переменные
- Он использует сохраненные функции
- Использует пользовательские функции
- Она находится внутри транзакции с уровнем изоляции СЕРИАЛИЗАБЛИЗАЦИИ.
- Это запрос таблицы внутри транзакции после того,как та же самая таблица выполнила проверку кэша запросов на недействительность с помощью INSERT,UPDATE или DELETE.
В самом запросе также можно указать, что он не должен храниться в кэше, используя атрибут . Управление на уровне запроса — эффективный способ более оптимального использования кеша.
Кроме того , можно указать , что нет запросов не должны храниться в кэше , если запрос не требует. Для этого серверная переменная должна иметь значение или . Затем кэшируются только запросы с атрибутом .
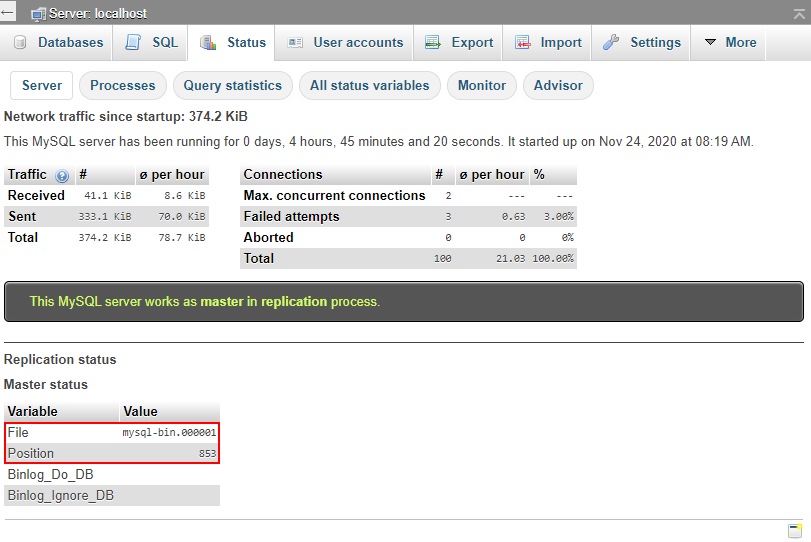
Пример конфигурации MySQL сервера с 1G — 2G ОЗУ
# Example MySQL config file for very large systems.## This is for a large system with memory of 1G-2G where the system runs mainly# MySQL.## MySQL programs look for option files in a set of# locations which depend on the deployment platform.# You can copy this option file to one of those# locations. For information about these locations, see:# http ://dev.mysql.com/doc/mysql/en/option-files.html## In this file, you can use all long options that a program supports.# If you want to know which options a program supports, run the program# with the "--help" option.
# The following options will be passed to all MySQL clients#password = your_passwordport = 3306socket = /var/lib/mysql/mysql.sock
# Here follows entries for some specific programs
# The MySQL serverport = 3306socket = /var/lib/mysql/mysql.sockskip-lockingkey_buffer_size = 384Mmax_allowed_packet = 1Mtable_open_cache = 512sort_buffer_size = 2Mread_buffer_size = 2Mread_rnd_buffer_size = 8Mmyisam_sort_buffer_size = 64Mthread_cache_size = 8query_cache_size = 32M# Try number of CPU's*2 for thread_concurrencythread_concurrency = 4
# Don't listen on a TCP/IP port at all. This can be a security enhancement,# if all processes that need to connect to mysqld run on the same host.# All interaction with mysqld must be made via Unix sockets or named pipes.# Note that using this option without enabling named pipes on Windows# (via the "enable-named-pipe" option) will render mysqld useless!##skip-networking
# Replication Master Server (default)# binary logging is required for replicationlog-bin=mysql-bin
# required unique id between 1 and 2^32 - 1# defaults to 1 if master-host is not set# but will not function as a master if omittedserver-id = 1
# Replication Slave (comment out master section to use this)## To configure this host as a replication slave, you can choose between# two methods :## 1) Use the CHANGE MASTER TO command (fully described in our manual) -# the syntax is:## CHANGE MASTER TO MASTER_HOST=, MASTER_PORT=,# MASTER_USER=, MASTER_PASSWORD= ;## where you replace , , by quoted strings and# by the master's port number (3306 by default).## Example:## CHANGE MASTER TO MASTER_HOST='125.564.12.1', MASTER_PORT=3306,# MASTER_USER='joe', MASTER_PASSWORD='secret';## OR## 2) Set the variables below. However, in case you choose this method, then# start replication for the first time (even unsuccessfully, for example# if you mistyped the password in master-password and the slave fails to# connect), the slave will create a master.info file, and any later# change in this file to the variables' values below will be ignored and# overridden by the content of the master.info file, unless you shutdown# the slave server, delete master.info and restart the slaver server.# For that reason, you may want to leave the lines below untouched# (commented) and instead use CHANGE MASTER TO (see above)## required unique id between 2 and 2^32 - 1# (and different from the master)# defaults to 2 if master-host is set# but will not function as a slave if omitted#server-id = 2## The replication master for this slave - required#master-host =## The username the slave will use for authentication when connecting# to the master - required#master-user =## The password the slave will authenticate with when connecting to# the master - required#master-password =## The port the master is listening on.# optional - defaults to 3306#master-port =## binary logging - not required for slaves, but recommended#log-bin=mysql-bin## binary logging format - mixed recommended#binlog_format=mixed
# Uncomment the following if you are using InnoDB tables#innodb_data_home_dir = /var/lib/mysql#innodb_data_file_path = ibdata1:2000M;ibdata2:10M:autoextend#innodb_log_group_home_dir = /var/lib/mysql# You can set .._buffer_pool_size up to 50 - 80 %# of RAM but beware of setting memory usage too high#innodb_buffer_pool_size = 384M#innodb_additional_mem_pool_size = 20M# Set .._log_file_size to 25 % of buffer pool size#innodb_log_file_size = 100M#innodb_log_buffer_size = 8M#innodb_flush_log_at_trx_commit = 1#innodb_lock_wait_timeout = 50
quickmax_allowed_packet = 16M
no-auto-rehash# Remove the next comment character if you are not familiar with SQL#safe-updates
key_buffer_size = 256Msort_buffer_size = 256Mread_buffer = 2Mwrite_buffer = 2M
interactive-timeout
Фрагментация кэша запросов
Кэш запросов использует блоки переменной длины и со временем может стать фрагментированным. Высокое значение относительно может указывать на фрагментацию. выполнит дефрагментацию кеша запросов без отбрасывания запросов:
FLUSH QUERY CACHE;
После этого будет только один свободный блок:
SHOW STATUS LIKE 'Qcache%';
+
| Variable_name           | Value    |
+
| Qcache_free_blocks      | 1        |
| Qcache_free_memory      | 6101576  |
| Qcache_hits             | 31981126 |
| Qcache_inserts          | 43002404 |
| Qcache_lowmem_prunes    | 34696486 |
| Qcache_not_cached       | 655607   |
| Qcache_queries_in_cache | 4197     |
| Qcache_total_blocks     | 8833     |
+
Examining the Query Cache
A number of status variables provide information about the query cache.
SHOW STATUS LIKE 'Qcache%';
+-------------------------+----------+
| Variable_name           | Value    |
+-------------------------+----------+
| Qcache_free_blocks      | 1158     |
| Qcache_free_memory      | 3760784  |
| Qcache_hits             | 31943398 |
| Qcache_inserts          | 42998029 |
| Qcache_lowmem_prunes    | 34695322 |
| Qcache_not_cached       | 652482   |
| Qcache_queries_in_cache | 4628     |
| Qcache_total_blocks     | 11123    |
+-------------------------+----------+
contains the number of queries added to the query cache, contains the number of queries that have made use of the query cache, while contains the number of queries that were dropped from the cache due to lack of memory.
The above example could indicate a poorly performing cache. More queries have been added, and more queries have been dropped, than have actually been used.
Note that before MariaDB 5.5, queries returned from the query cache did not increment the status variable, so to find the total number of valid queries run on the server, add to . Starting from MariaDB 5.5, results returned by the query cache count towards (see MDEV-4981).
The QUERY_CACHE_INFO plugin creates the QUERY_CACHE_INFO table in the INFORMATION_SCHEMA, allowing you to examine the contents of the query cache.
Query Cache Internal Structure
Internally, each flag that can change a result using the same query is a different query. For example, using the latin1 charset and using the utf8 charset with the same query are treated as different queries by the query cache.
Some fields that differentiate queries are (from «Query_cache_query_flags» internal structure) :
- query (string)
- current database schema name (string)
- client long flag (0/1)
- client protocol 4.1 (0/1)
- protocol type (internal value)
- more results exists (protocol flag)
- in trans (inside transaction or not)
- autocommit ( session variable)
- pkt_nr (protocol flag)
- character set client ( session variable)
- character set results ( session variable)
- collation connection ( session variable)
- limit ( session variable)
- time zone ( session variable)
- sql_mode ( session variable)
- max_sort_length ( session variable)
- group_concat_max_len ( session variable)
- default_week_format ( session variable)
- div_precision_increment ( session variable)
- lc_time_names ( session variable)
More information can be found by viewing the source code (MariaDB 10.1) :
- https://github.com/MariaDB/server/blob/10.1/sql/sql_cache.cc
- https://github.com/MariaDB/server/blob/10.1/sql/sql_cache.h
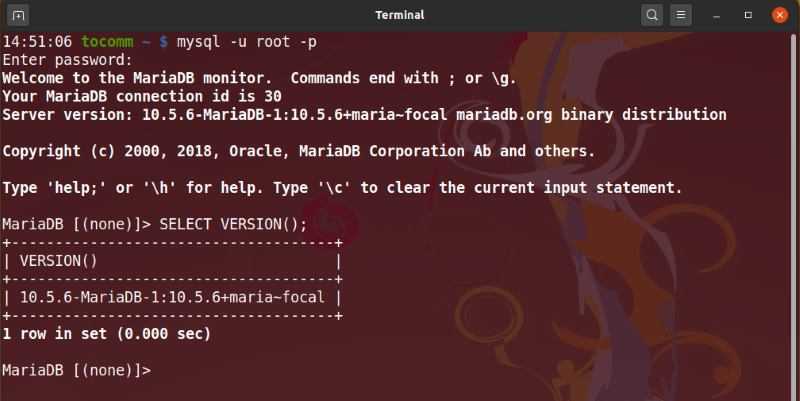
5: Тестирование MySQL с поддержкой кэша запросов
Теперь давайте повторим тот запрос, который мы выполнили в разделе 3, чтобы посмотреть, как кэш запросов оптимизировал производительность сервера MySQL.
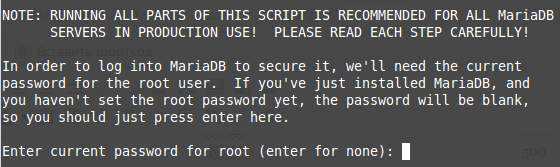
Сначала подключитесь к серверу MySQL как root:
Введите свой root пароль для сервера базы данных и нажмите Enter, чтобы продолжить.
Теперь проверьте свой набор переменных, чтобы убедиться, что вы включили кэш запросов:
Вы увидите следующий вывод:
Переменная query_cache_type имеет значение ON; это подтверждает, что вы включили кэш запросов с параметрами, которые определили на предыдущем этапе.
Перейдите в базу данных sample_db, которую вы создали ранее.
Запустите профайлер:
Затем выполните запрос, чтобы вывести список всех клиентов как минимум два раза (чтоб собрать достаточно информации для профилирования).
После того как вы выполните первый запрос, MySQL создаст кэш результатов, и, следовательно, вы должны повторить запрос еще раз, чтобы вызвать значение из кэша, если все работает правильно:
Затем запросите информацию о профилях:
Вы получите такой вывод:
Как видите, время, затраченное на выполнение запроса, резко сократилось с 0,00044075 (без кэша запросов ) до 0,00026000 (обратите внимание на второй запрос). Вы можете оценить преимущества кэширования запросов с помощью детального профилирования первого запроса:
Вы можете оценить преимущества кэширования запросов с помощью детального профилирования первого запроса:
Выполните следующую команду, чтобы отобразить информацию о втором запросе:
Выводы профайлера показывают, что MySQL потратил меньше времени на обработку второго запроса, потому что он мог извлечь данные из кэша запросов, а не с диска. Вы можете сравнить два вывода для каждого из запросов. Если вы посмотрите информацию о профиле для QUERY 2, состояние sending cached result to client показывает, что данные были прочитаны из кэша и таблицы не открывались (статуса Opening tables не будет).

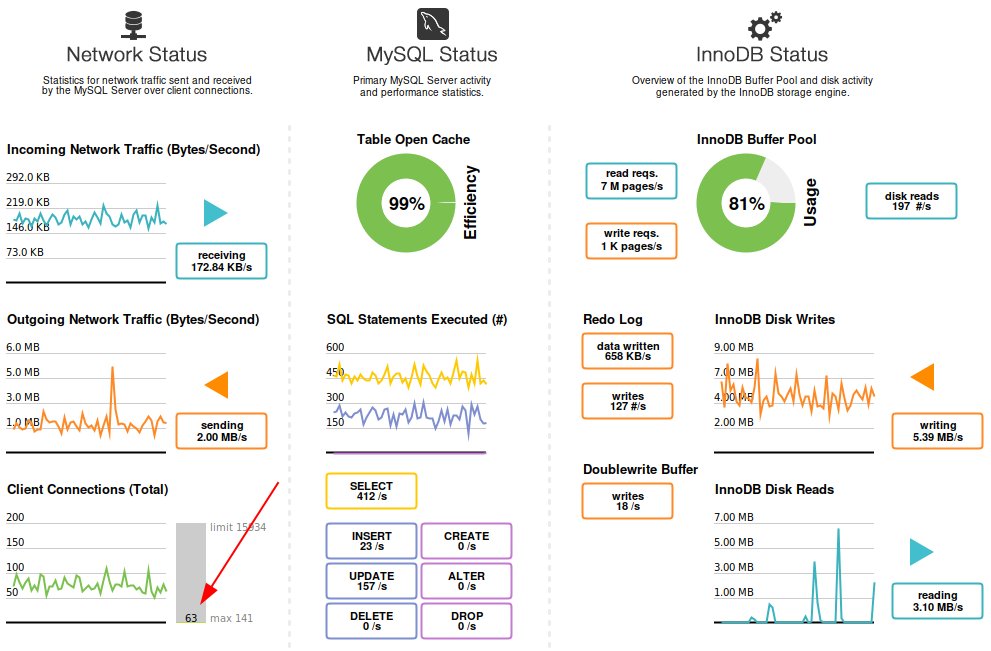

![Mysql (mariadb и так далее) - тюним innodb_buffer_pool_size [rtzra's hive]](https://myeditor.ru/wp-content/uploads/0/4/6/0466a94fecb834b296a58c359ff58c1e.png)
Если на вашем сервере включена функция кэширования запросов MySQL, вы сможете улучшить скорость чтения данных.
How the Query Cache Works
When the query cache is enabled and a new SELECT query is processed, the query cache is examined to see if the query appears in the cache.
Queries are considered identical if they use the same database, same protocol version and same default character set. Prepared statements are always considered as different to non-prepared statements, see for more info.
If the identical query is not found in the cache, the query will be processed normally and then stored, along with its result set, in the query cache. If the query is found in the cache, the results will be pulled from the cache, which is much quicker than processing it normally.
Queries are examined in a case-sensitive manner, so :
SELECT * FROM t
Is different from :
select * from t
Comments are also considered and can make the queries differ, so :
/* retry */SELECT * FROM t
Is different from :
/* retry2 */SELECT * FROM t
See the server variable for an option to strip comments before searching.
Each time changes are made to the data in a table, all affected results in the query cache are cleared. It is not possible to retrieve stale data from the query cache.
When the space allocated to query cache is exhausted, the oldest results will be dropped from the cache.
When using , and the query specifies (case-insensitive), the server will not cache the query and will not fetch results from the query cache.
When using (after MDEV-6631 feature request) and the query specifies , the server will cache the query.
One important point of MDEV-6631 is : switching between and can «turn off» query cache of old queries without the string, that’s not yet defined if we should include another (DEMAND_NO_PRUNE) value or not to allow use of old queries
Настройка и оптимизация Open LiteSpeed
Настраивать OLS и хосты можно текстовыми конфигурационными файлами. На мой взгляд гораздо удобнее и нагляднее настраивать сервер из WebAdmin в браузере. он доступен по адресу https://ip-servera:7080/ . Вы получите сообщение о том, что ваше соединение не защищено.
Жмем <Advanced>. Подтверждаем согласие продолжить использовать небезопасное соединение. (Не составляет труда установить ssl сертификат, но это можно сделать и позже). Вводим логин и пароль (они у вас были созданы на этапе создания сервера).
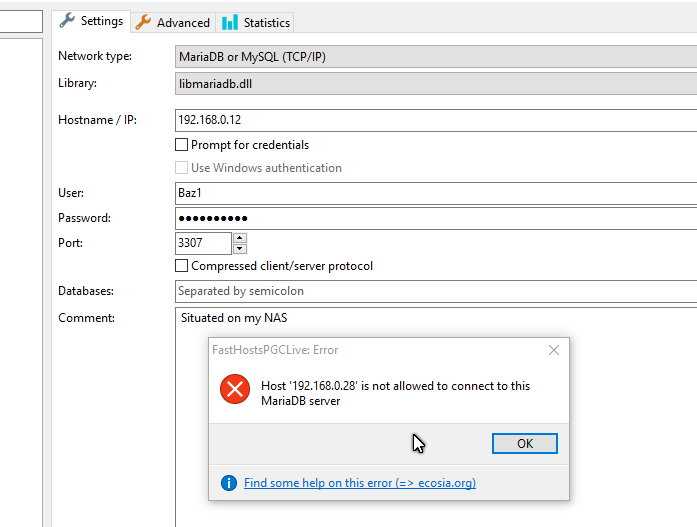
Проблема доступа в WebAdmin
Если вы не можете получить доступ к консоли, вам необходимо разрешить соединение на порт 7080 в firewall. Сделать это можно в Cyberpanel.
- Log in to Cyber Panel – Security – Firewall
- Add Rule Name ” webpanel “
- Select TCP
- IP Address ” 0.0.0.0/0 “
- Port ” 7080 “
- Click on Add – Then, Reload The Page and Confirm Port 7080 is Added.
Или в терминале:
Решение 2
Here is what you should do. First run this query
SELECT CEILING(Total_InnoDB_Bytes*1.6POWER(1024,3)) RIBPS FROM (SELECT SUM(data_length+index_length) Total_InnoDB_Bytes
FROM information_schema.tables WHERE engine='InnoDB') A;
This will give you the RIBPS, Recommended InnoDB Buffer Pool Size based on all InnoDB Data and Indexes with an additional 60%.
For Example
mysql>     SELECT CEILING(Total_InnoDB_Bytes*1.6/POWER(1024,3)) RIBPS FROM
    ->     (SELECT SUM(data_length+index_length) Total_InnoDB_Bytes
    ->     FROM information_schema.tables WHERE engine='InnoDB') A;
+-------+
| RIBPS |
+-------+
|     8 |
+-------+
1 row in set (4.31 sec)

mysql>
With this output, you would set the following in /etc/my.cnf
innodb_buffer_pool_size=8G
Next, service mysql restart
After the restart, run mysql for a week or two. Then, run this query:
SELECT (PagesData*PageSize)POWER(1024,3) DataGB FROM (SELECT variable_value PagesData FROM information_schema.global_status
WHERE variable_name='Innodb_buffer_pool_pages_data') A, (SELECT variable_value PageSize FROM information_schema.global_status
WHERE variable_name='Innodb_page_size') B;
This will give you how many actual GB of memory is in use by InnoDB Data in the InnoDB Buffer Pool at this moment.