Restrictions in your Firewall
There might also be a firewall restriction preventing your DNS queries. That is why we always recommend installing CyberPanel for free, CyberPanel will open all default ports for you, it will also help you run a super-fast website. Install CyberPanel for free using the install guide. You can also learn how CyberPanel will help you run the super fast website by reading our OpenLiteSpeed vs NGINX article.
Let see if this is actually a firewall error by stopping the firewall.
Firewalld
Or CSF
Now test and see if your issue is resolved if so, it means that your firewall is preventing your DNS queries.
Fix for Firewalld
You can add port 53 (UDP) and 43 (whois) to your firewalld. Following commands can be used
This will open DNS related ports in FirewallD. If you are using CyberPanel you can easily go to CyberPanel firewalld interface and add these ports without going to CLI.
Go to -> https://<IP Address>:8090/firewall/
There you can easily open these two ports.
Fix for CSF
Open file /etc/CSF/csf.conf, then find the line containing TCP_IN and TCP_OUT then add your desired ports. Once your desired ports are added simply restart CSF so that your changes can take effect
To remove any ports, you can just remove those ports from same lines and restart CSF.
Again if you are using CyberPanel and you have installed CSF (this will disable Firewalld interface). You can easily go to -> https://<IP Address>:8090/firewall/csf
From there you can add your ports and CyberPanel will take care of everything.
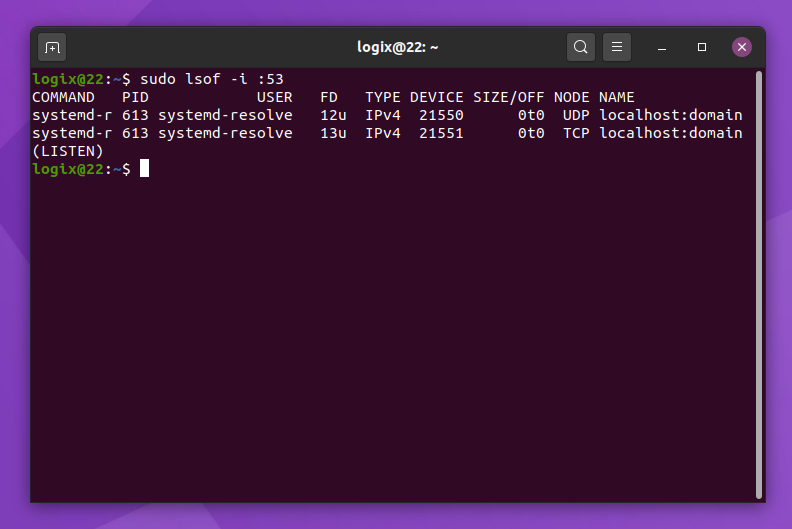
Отсутствующий или неправильно настроенный файл resolv.conf
Этот файл является файлом конфигурации преобразователя в системах Linux. Он содержит записи DNS, которые помогают вашей системе Linux преобразовывать доменные имена в IP-адреса.
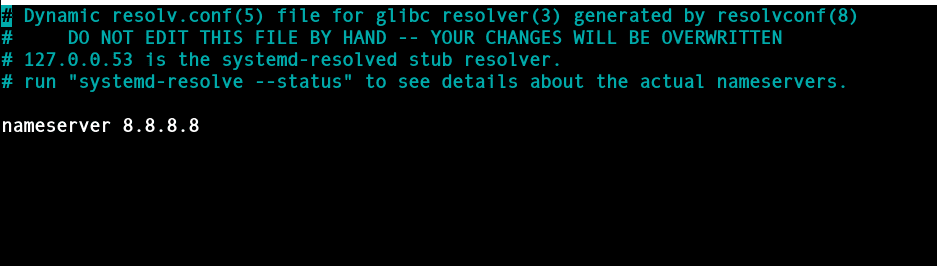
Если этот файл отсутствует или существует, но ошибка разрешения имени все еще возникает, создайте его и добавьте общедоступный DNS-сервер Google, как показано
nameserver 8.8.8.8
Сохраните изменения и перезапустите службу systemd-resolved, как показано.
$ sudo systemctl restart systemd-resolved.service
Также разумно проверить состояние резолвера и убедиться, что он активен и работает должным образом:
$ sudo systemctl status systemd-resolved.service
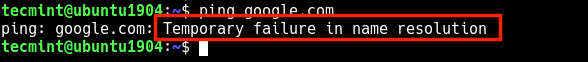
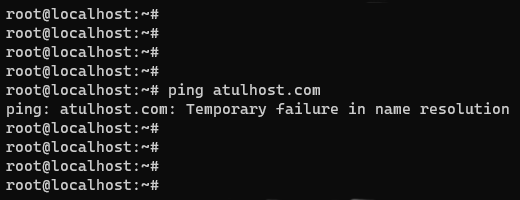
Затем попробуйте проверить связь с любым веб-сайтом, и проблема должна быть решена.
intellect@ubuntu : ~ $ ping google.com
![]()
Однако в убунту 20 этот файл скоррее всего перезатрется и ДНС будует 127.0.0.53
Audit and analytic event logging
Enhanced DNS logging and diagnostics in Windows Server 2012 R2 and later includes DNS Audit events and DNS Analytic events. DNS audit logs are enabled by default, and do not significantly affect DNS server performance. DNS analytical logs are not enabled by default, and typically will only affect DNS server performance at very high DNS query rates. For example, a DNS server running on modern hardware that is receiving 100,000 queries per second (QPS) can experience a performance degradation of 5% when analytic logs are enabled. There is no apparent performance impact for query rates of 50,000 QPS and lower. However, it is always advisable to monitor DNS server performance whenever additional logging is enabled.
Resolution
Set up a local DNS cache, using dnsmasq (a DHCP and cache DNS server). For an overview of dnsmasq, see the dnsmasq documentation.
1. Install the dnsmasq server by running the following command:
2. Create a dedicated system user to run dnsmasq using the following commands:
Note: dnsmasq typically runs as the root user, but drops root privileges after startup by changing to another user (by default, the user is «nobody»).
3. Create a copy of the dnsmasq.conf file using the following command:
4. Open the configuration file using a text editor (for example, vim):
5. Edit the /etc/dnsmasq.conf file so that it is similar to the following:
6. Create the /etc/resolv.dnsmasq file, and then set the or the custom domain-name-servers that you have specified on .
Note: For EC2-Classic, the Amazon DNS server is located at 172.16.0.23. For EC2-VPC, you can find more information about DNS server locations at . If you create an AMI from an instance with the dnsmasq cache to launch in another VPC with a different CIDR, or if you have a custom DNS server specified in your DHCP options, then adjust the file /etc/resolv.dnsmasq to use the nameserver for that network.
7. Restart the dnsmasq server and set the service to start up on boot using the following commands:
Amazon Linux 1
Amazon Linux 2
8. Verify that dnsmasq is working correctly using the dig command:
If the response is similar to the following, then the dnsmasq cache is working correctly:
9. Set the dnsmasq DNS cache as the default DNS resolver.
Note: You must suppress the default DNS resolver provided by DHCP by changing or creating the /etc/dhcp/dhclient.conf file. For more information, see My private Amazon EC2 instance is running Amazon Linux, Ubuntu, or RHEL. How do I assign a static DNS server to the EC2 instance that persists during reboot?
10. Configure the default DNS resolver as a fallback option by using the following commands:
11. To apply the change, run the dhclient command, or reboot your instance:
— or —
To verify that your instance is using the DNS cache, run the dig command:
If the response indicates that the server replying to your DNS request is 127.0.0.1, then the DNS cache is working correctly:
Automation
You can use one of the following to automate the installation and configuration of dnsmasq as a DNS resolver on Amazon Linux:
- AutomateDnsmasq.sh Bash script
- AutomateDnsmasq.cloudinit directives
If you want to automate the dnsmasq installation on other Linux distributions, you can use either file to make the necessary customization.
Both files can run on VPC instances or EC2-Classic because they use the of 169.254.169.253 for VPC and 172.16.0.23 for EC2-Classic.
You can run either file at launch time by . You can run the Bash script as a standalone script or with an AWS Systems Manager run command to perform the actions on an existing instance.
To run the Bash script as a standalone script:
1. Download the script on your instance and make it executable.
2. Run the following command as a root user or use sudo.
Debug logging
Prior to the introduction of DNS analytic logs, DNS debug logging was an available method to monitor DNS transactions. DNS debug logging is not the same as the enhanced DNS logging and diagnostics feature discussed in this topic. Debug logging is discussed here because it is also a tool that is available for DNS logging and diagnostics. See Using server debugging logging options for more information about DNS debug logging. The DNS debug log provides extremely detailed data about all DNS information that is sent and received by the DNS server, similar to the data that can be gathered using packet capture tools such as network monitor. Debug logging can affect overall server performance and also consumes disk space, therefore it is recommended to enable debug logging only temporarily when detailed DNS transaction information is needed.
Using ip a to Check Interface States
On compute nodes and nodes running , use the following
command to see information about interfaces, including information about
IPs, VLANs, and whether your interfaces are up:
# ip a
If you are encountering any sort of networking difficulty, one good initial
troubleshooting step is to make sure that your interfaces are up. For example:
$ ip a | grep state
1: lo: <LOOPBACK,UP,LOWER_UP> mtu 16436 qdisc noqueue state UNKNOWN
2: eth0: <BROADCAST,MULTICAST,UP,LOWER_UP> mtu 1500 qdisc pfifo_fast state UP
   qlen 1000
3: eth1: <BROADCAST,MULTICAST,UP,LOWER_UP> mtu 1500 qdisc pfifo_fast
   master br100 state UP qlen 1000
4: virbr0: <NO-CARRIER,BROADCAST,MULTICAST,UP> mtu 1500 qdisc noqueue state DOWN
5: br100: <BROADCAST,MULTICAST,UP,LOWER_UP> mtu 1500 qdisc noqueue state UP
Using ETW consumers
You can use ETW consumers such as tracelog.exe with DNS server audit and analytic events by specifying a GUID of {EB79061A-A566-4698-9119-3ED2807060E7}.
You can get tracelog.exe by downloading and installing the Windows Driver Kit (WDK). Tracelog.exe is included when you install the WDK, Visual Studio, and the Windows SDK for desktop apps. For information about downloading the kits, see Windows Hardware Downloads. For example, when you download and install Windows Driver Kit (WDK) 8 and accept the default installation path, tracelog.exe is available at C:\Program Files (x86)\Windows Kits\8.0\Tools\x64\tracelog.exe.
For more information about using tracelog.exe, see Tracelog Command Syntax. The following examples demonstrate how to use tracelog.exe with DNS audit and analytic event logs:
The following command will enable both analytical and audit logging:
While the trace is active, all analytical and audit events will be recorded in the C:\analytic_audit.etl file that was specified on the command line. You can stop tracing by issuing a stop command:
After stopping the trace, you can view the .etl file in Event Viewer by clicking Action and then clicking Open Saved Log. See the following example.
![]()
The following example enables just the analytical channel and matches only the keywords to 0x7FFFF:
A logging level of 5 is used in the previous examples. The following logging levels are available:
|
Logging level |
Description |
|---|---|
|
0 (None) |
Logging OFF |
|
1 (Critical) |
Only critical events are logged, for example process exit or termination. If no logging level is given by the user this level is used by default. |
|
2 (Error) |
Only severe error events are logged, for example failures to complete a required task. |
|
3 (Warning) |
Errors that can cause a service issue, but are acceptable or recoverable, for example the first attempt to contact a forwarder has failed. |
|
4 (Informational) |
Very high-level events are recorded in the event log. These might include one message for each major task performed by the service. Use this setting to begin an investigation when the location of the problem is in doubt, for example a scavenger thread was started. |
|
5 (Verbose) |
All events are logged. This provides a complete log of the operation of the service. Use this level when the problem is traced to a particular category or a small set of categories. |
Dealing with Network Namespaces
Linux network namespaces are a kernel feature the networking service
uses to support multiple isolated layer-2 networks with overlapping IP
address ranges. The support may be disabled, but it is on by default. If
it is enabled in your environment, your network nodes will run their
dhcp-agents and l3-agents in isolated namespaces. Network interfaces and
traffic on those interfaces will not be visible in the default
namespace.
To see whether you are using namespaces, run ip netns:
# ip netns
qdhcp-e521f9d0-a1bd-4ff4-bc81-78a60dd88fe5
qdhcp-a4d00c60-f005-400e-a24c-1bf8b8308f98
qdhcp-fe178706-9942-4600-9224-b2ae7c61db71
qdhcp-0a1d0a27-cffa-4de3-92c5-9d3fd3f2e74d
qrouter-8a4ce760-ab55-4f2f-8ec5-a2e858ce0d39
L3-agent router namespaces are named , and
dhcp-agent name spaces are named . This output
shows a network node with four networks running dhcp-agents, one of
which is also running an l3-agent router. It’s important to know which
network you need to be working in. A list of existing networks and their
UUIDs can be obtained by running with
administrative credentials.
Once you’ve determined which namespace you need to work in, you can use
any of the debugging tools mention earlier by prefixing the command with
. For example, to see what network
interfaces exist in the first qdhcp namespace returned above, do this:
# ip netns exec qdhcp-e521f9d0-a1bd-4ff4-bc81-78a60dd88fe5 ip a
10: tape6256f7d-31: <BROADCAST,UP,LOWER_UP> mtu 1500 qdisc noqueue state UNKNOWN
    link/ether fa:16:3e:aa:f7:a1 brd ff:ff:ff:ff:ff:ff
    inet 10.0.1.100/24 brd 10.0.1.255 scope global tape6256f7d-31
    inet 169.254.169.254/16 brd 169.254.255.255 scope global tape6256f7d-31
    inet6 fe80::f816:3eff:feaa:f7a1/64 scope link
    valid_lft forever preferred_lft forever
28: lo: <LOOPBACK,UP,LOWER_UP> mtu 16436 qdisc noqueue state UNKNOWN
    link/loopback 00:00:00:00:00:00 brd 00:00:00:00:00:00
    inet 127.0.0.1/8 scope host lo
    inet6 ::1/128 scope host
    valid_lft forever preferred_lft forever
tcpdump
One great, although very in-depth, way of troubleshooting network issues
is to use . We recommended using at several
points along the network path to correlate where a problem might be. If
you prefer working with a GUI, either live or by using a
capture, check out
Wireshark.
For example, run the following command:
# tcpdump -i any -n -v 'icmp = icmp-echoreply or icmp = icmp-echo'
Run this on the command line of the following areas:
-
An external server outside of the cloud
-
A compute node
-
An instance running on that compute node
In this example, these locations have the following IP addresses:
Instance
    10.0.2.24
    203.0.113.30
Compute Node
    10.0.0.42
    203.0.113.34
External Server
    1.2.3.4
Next, open a new shell to the instance and then ping the external host
where is running. If the network path to the external server
and back is fully functional, you see something like the following:
On the external server:
12:51:42.020227 IP (tos 0x0, ttl 61, id 0, offset 0, flags ,
proto ICMP (1), length 84)
    203.0.113.30 > 1.2.3.4: ICMP echo request, id 24895, seq 1, length 64
12:51:42.020255 IP (tos 0x0, ttl 64, id 8137, offset 0, flags ,
proto ICMP (1), length 84)
    1.2.3.4 > 203.0.113.30: ICMP echo reply, id 24895, seq 1,
    length 64
On the compute node:
12:51:42.019519 IP (tos 0x0, ttl 64, id 0, offset 0, flags ,
proto ICMP (1), length 84)
    10.0.2.24 > 1.2.3.4: ICMP echo request, id 24895, seq 1, length 64
12:51:42.019519 IP (tos 0x0, ttl 64, id 0, offset 0, flags ,
proto ICMP (1), length 84)
    10.0.2.24 > 1.2.3.4: ICMP echo request, id 24895, seq 1, length 64
12:51:42.019545 IP (tos 0x0, ttl 63, id 0, offset 0, flags ,
proto ICMP (1), length 84)
    203.0.113.30 > 1.2.3.4: ICMP echo request, id 24895, seq 1, length 64
12:51:42.019780 IP (tos 0x0, ttl 62, id 8137, offset 0, flags ,
proto ICMP (1), length 84)
    1.2.3.4 > 203.0.113.30: ICMP echo reply, id 24895, seq 1, length 64
12:51:42.019801 IP (tos 0x0, ttl 61, id 8137, offset 0, flags ,
proto ICMP (1), length 84)
    1.2.3.4 > 10.0.2.24: ICMP echo reply, id 24895, seq 1, length 64
12:51:42.019807 IP (tos 0x0, ttl 61, id 8137, offset 0, flags ,
proto ICMP (1), length 84)
    1.2.3.4 > 10.0.2.24: ICMP echo reply, id 24895, seq 1, length 64
On the instance:
12:51:42.020974 IP (tos 0x0, ttl 61, id 8137, offset 0, flags ,
proto ICMP (1), length 84)
 1.2.3.4 > 10.0.2.24: ICMP echo reply, id 24895, seq 1, length 64
Troubleshooting Open vSwitch
Open vSwitch, as used in the previous OpenStack Networking examples is a
full-featured multilayer virtual switch licensed under the open source
Apache 2.0 license. Full documentation can be found at the project’s
website. In practice, given the preceding
configuration, the most common issues are being sure that the required
bridges (, , and ) exist and have the
proper ports connected to them.
The Open vSwitch driver should and usually does manage this
automatically, but it is useful to know how to do this by hand with the
ovs-vsctl command. This command has many more subcommands than we
will use here; see the man page or use ovs-vsctl —help for the
full listing.
To list the bridges on a system, use ovs-vsctl list-br.
This example shows a compute node that has an internal
bridge and a tunnel bridge. VLAN networks are trunked through the
network interface:
# ovs-vsctl list-br
br-int
br-tun
eth1-br
Working from the physical interface inwards, we can see the chain of
ports and bridges. First, the bridge , which contains the
physical network interface and the virtual interface
:
# ovs-vsctl list-ports eth1-br
eth1
phy-eth1-br
Next, the internal bridge, , contains , which
pairs with to connect to the physical network shown in
the previous bridge, , which is used to connect to the GRE
tunnel bridge and the TAP devices that connect to the instances
currently running on the system:
# ovs-vsctl list-ports br-int
int-eth1-br
patch-tun
tap2d782834-d1
tap690466bc-92
tap8a864970-2d
The tunnel bridge, , contains the interface and
interfaces for each peer it connects to via GRE, one for
each compute and network node in your cluster:
# ovs-vsctl list-ports br-tun
patch-int
gre-1
.
.
.
gre-<N>
Installing and enabling DNS diagnostic logging
Perform the following procedures to install and enable DNS diagnostic logging on Windows Server 2012 R2. To install DNS diagnostic logging, the computer must be running the DNS Server role service.
If the DNS server is running Windows Server 2016 Technical Preview or later, diagnostic logging is already installed and you can skip the first procedure, performing only the steps in To enable DNS diagnostic logging below.
Membership in the Administrators group, or equivalent, is the minimum required to complete these procedures. Review details about using the appropriate accounts and group memberships at Local and Domain Default Groups (https://go.microsoft.com/fwlink/?LinkId=83477).
To install DNS diagnostic logging
-
If the DNS server is running Windows Server 2012 R2, download the hotfix from https://support.microsoft.com/kb/2956577.
-
Double-click the self-extracting file, for example 475151_intl_x64_zip.exe.
-
In the Microsoft Self-Extractor dialog box, click Continue.
-
Type a location where you want to save the extracted files, for example C:\hotfix. If the directory does not yet exist, you will be asked if you wish to create it. Click Yes and confirm that All files were successfully unzipped is displayed, then click Ok.
-
In the location where files were unzipped, double-click the Windows Update file, for example Windows8.1-KB2956577-v2-x64.msu.
-
The Windows Update Standalone Installer will verify that the computer meets requirements to install the update. These requirements include some prerequisite updates. When verification is complete, click Yes when asked if you wish to install the Hotfix for Windows (KB2956577).
-
If recently downloaded updates have not yet been installed, you might need to restart the computer before the current hotfix can be installed. If this is required, you must restart the computer first and then run the Windows8.1-KB2956577-v2-x64.msu a second time after the computer has completed installing necessary updates. The Windows Update Standalone Installer will notify you that installation of the hotfix is not yet complete. If this happens, and you are prompted to restart the computer, click Restart Now.
-
If the computer is ready to install the update when you run the hotfix, installation will complete and you must restart the computer for the update to take effect. If Installation complete is displayed, click Restart Now for the update to take effect.
You can confirm that the hotfix was successfully installed by viewing installed updates in the Programs and Features control panel. If the update is successfully installed, Hotfix for Microsoft Windows (KB2956577) will be displayed. You can also verify installation of the hotfix by typing wmic qfe | find «KB2956577» at an elevated command prompt. The URL and date of installation for the hotfix will be displayed if it was successfully installed.
To enable DNS diagnostic logging
-
Type eventvwr.msc at an elevated command prompt and press ENTER to open Event Viewer.
-
In Event Viewer, navigate to Applications and Services Logs\Microsoft\Windows\DNS-Server.
-
Right-click DNS-Server, point to View, and then click Show Analytic and Debug Logs. The Analytical log will be displayed.
-
Right-click Analytical and then click Properties.
-
Under When maximum event log size is reached, choose Do not overwrite events (Clear logs manually), select the Enable logging checkbox, and click OK when you are asked if you want to enable this log. See the following example.
-
Click OK again to enable the DNS Server Analytic event log.
By default, analytic logs are written to the file: %SystemRoot%\System32\Winevt\Logs\Microsoft-Windows-DNSServer%4Analytical.etl.
See the following sections for details about events that are displayed in the DNS server audit and analytic event logs.
Ограничения брандмауэра
Если первое решение не помогло вам, ограничения брандмауэра могут мешать вам успешно выполнять DNS-запросы. Проверьте свой брандмауэр и убедитесь, что порт 53 (используется для DNS — разрешение доменного имени) и порт 43 (используется для поиска whois ) открыты. Если порты заблокированы, откройте их следующим образом:
Для брандмауэра UFW (Ubuntu / Debian и Mint)
Чтобы открыть порты 53 и 43 на брандмауэре UFW, выполните следующие команды:
$ sudo ufw allow 53 / tcp
$ sudo ufw allow 43 / tcp
$ sudo ufw reload
Для firewalld (RHEL / CentOS / Fedora)
Для систем на основе Redhat, таких как CentOS, выполните следующие команды:
$ sudo firewall-cmd --add-port = 53 / tcp --permanent
$ sudo firewall-cmd --add-port = 43 / tcp --permanent
$ sudo firewall-cmd --reload
Мы надеемся, что теперь у вас есть представление об ошибке « Temporary failure in name resolution » и о том, как ее исправить, выполнив несколько простых шагов. Как всегда, мы будем благодарны за ваши отзывы.
Analytic events
DNS server analytic events enable activity tracking on the DNS server. An analytic event is logged each time the server sends or receives DNS information. The following table summarizes DNS server analytic events.
Table 2: DNS Server Analytic Events
|
Event ID |
Type |
Category |
Level |
Event text |
|---|---|---|---|---|
|
257 |
Response success |
Lookup |
Informational |
RESPONSE_SUCCESS: TCP=%1; InterfaceIP=%2; Destination=%3; AA=%4; AD=%5; QNAME=%6; QTYPE=%7; XID=%8; DNSSEC=%9; RCODE=%10; Port=%11; Flags=%12; Scope=%13; Zone=%14; PolicyName=%15; PacketData=%17 |
|
258 |
Response failure |
Lookup |
Error |
RESPONSE_FAILURE: TCP=%1; InterfaceIP=%2; Reason=%3; Destination=%4; QNAME=%5; QTYPE=%6; XID=%7; RCODE=%8; Port=%9; Flags=%10; Zone=%11; PolicyName=%12; PacketData=%14 |
|
259 |
Ignored query |
Lookup |
Error |
IGNORED_QUERY: TCP=%1; InterfaceIP=%2; Reason=%3; QNAME=%4; QTYPE=%5; XID=%6; Zone=%7; PolicyName=%8 |
|
260 |
Query out |
Recursive query |
Informational |
RECURSE_QUERY_OUT: TCP=%1; Destination=%2; InterfaceIP=%3; RD=%4; QNAME=%5; QTYPE=%6; XID=%7; Port=%8; Flags=%9; ServerScope=%10; CacheScope=%11; PolicyName=%12; PacketData=%14 |
|
261 |
Response in |
Recursive query |
Informational |
RECURSE_RESPONSE_IN: TCP=%1; Source=%2; InterfaceIP=%3; AA=%4; AD=%5; QNAME=%6; QTYPE=%7; XID=%8; Port=%9; Flags=%10; ServerScope=%11; CacheScope=%12; PacketData=%14 |
|
262 |
Recursive query timeout |
Recursive query |
Error |
RECURSE_QUERY_TIMEOUT: TCP=%1; InterfaceIP=%2; Destination=%3; QNAME=%4; QTYPE=%5; XID=%6; Port=%7; Flags=%8; ServerScope=%9; CacheScope=%10 |
|
263 |
Update in |
Dynamic update |
Informational |
DYN_UPDATE_RECV: TCP=%1; InterfaceIP=%2; Source=%3; QNAME=%4; XID=%5; Port=%6; Flags=%7; SECURE=%8; PacketData=%10 |
|
264 |
Update response |
Dynamic update |
Informational |
DYN_UPDATE_RESPONSE: TCP=%1; InterfaceIP=%2; Destination=%3; QNAME=%4; XID=%5; ZoneScope=%6; Zone=%7; RCODE=%8; PolicyName=%9; PacketData=%11 |
|
265 |
IXFR request out |
Zone XFR |
Informational |
IXFR_REQ_OUT: TCP=%1; InterfaceIP=%2; Source=%3; QNAME=%4; XID=%5; ZoneScope=%6; Zone=%7; PacketData=%9 |
|
266 |
IXFR request in |
Zone XFR |
Informational |
IXFR_REQ_RECV: TCP=%1; InterfaceIP=%2; Source=%3; QNAME=%4; XID=%5; ZoneScope=%6; Zone=%7; PacketData=%9 |
|
267 |
IXFR response out |
Zone xfr |
Informational |
IXFR_RESP_OUT: TCP=%1; InterfaceIP=%2; Destination=%3; QNAME=%4; XID=%5; ZoneScope=%6; Zone=%7; RCODE=%8; PacketData=%10 |
|
268 |
IXFR response in |
Zone xfr |
Informational |
IXFR_RESP_RECV: TCP=%1; InterfaceIP=%2; Destination=%3; QNAME=%4; XID=%5; ZoneScope=%6; Zone=%7; RCODE=%8; PacketData=%10 |
|
269 |
AXFR request out |
Zone XFR |
Informational |
AXFR_REQ_OUT: TCP=%1; Source=%2; InterfaceIP=%3; QNAME=%4; XID=%5; ZoneScope=%6; Zone=%7; PacketData=%9 |
|
270 |
AXFR request in |
Zone XFR |
Informational |
AXFR_REQ_RECV: TCP=%1; Source=%2; InterfaceIP=%3; QNAME=%4; XID=%5; ZoneScope=%6; Zone=%7; PacketData=%9 |
|
271 |
AXFR response out |
Zone XFR |
Informational |
AXFR_RESP_OUT: TCP=%1; InterfaceIP=%2; Destination=%3; QNAME=%4; XID=%5; ZoneScope=%6; Zone=%7; RCODE=%8 |
|
272 |
AXFR response in |
Zone XFR |
Informational |
AXFR_RESP_RECV: TCP=%1; InterfaceIP=%2; Destination=%3; QNAME=%4; XID=%5; ZoneScope=%6; Zone=%7; RCODE=%8 |
|
273 |
XFR notification in |
Zone XFR |
Informational |
XFR_NOTIFY_RECV: Source=%1; InterfaceIP=%2; QNAME=%3; ZoneScope=%4; Zone=%5; PacketData=%7 |
|
274 |
XFR notification out |
Zone XFR |
Informational |
XFR_NOTIFY_OUT: Destination=%1; InterfaceIP=%2; QNAME=%3; ZoneScope=%4; Zone=%5; PacketData=%7 |
|
275 |
XFR notify ACK in |
Zone XFR |
Informational |
XFR_NOTIFY_ACK_IN: Source=%1; InterfaceIP=%2; PacketData=%4 |
|
276 |
XFR notify ACK out |
Zone XFR |
Informational |
XFR_NOTIFY_ACK_OUT: Destination=%1; InterfaceIP=%2; Zone=%3; PacketData=%5 |
|
277 |
Update forward |
Dynamic update |
Informational |
DYN_UPDATE_FORWARD: TCP=%1; ForwardInterfaceIP=%2; Destination=%3; QNAME=%4; XID=%5; ZoneScope=%6; Zone=%7; RCODE=%8; PacketData=%10 |
|
278 |
Update response in |
Dynamic update |
Informational |
DYN_UPDATE_RESPONSE_IN: TCP=%1; InterfaceIP=%2; Source=%3; QNAME=%4; XID=%5; ZoneScope=%6; Zone=%7; RCODE=%8; PacketData=%10 |
|
279 |
Internal lookup CNAME |
Lookup |
Informational |
INTERNAL_LOOKUP_CNAME: TCP=%1; InterfaceIP=%2; Source=%3; RD=%4; QNAME=%5; QTYPE=%6; Port=%7; Flags=%8; XID=%9; PacketData=%11 |
|
280 |
Internal lookup additional |
Lookup |
Informational |
INTERNAL_LOOKUP_ADDITIONAL: TCP=%1; InterfaceIP=%2; Source=%3; RD=%4; QNAME=%5; QTYPE=%6; Port=%7; Flags=%8; XID=%9; PacketData=%11 |
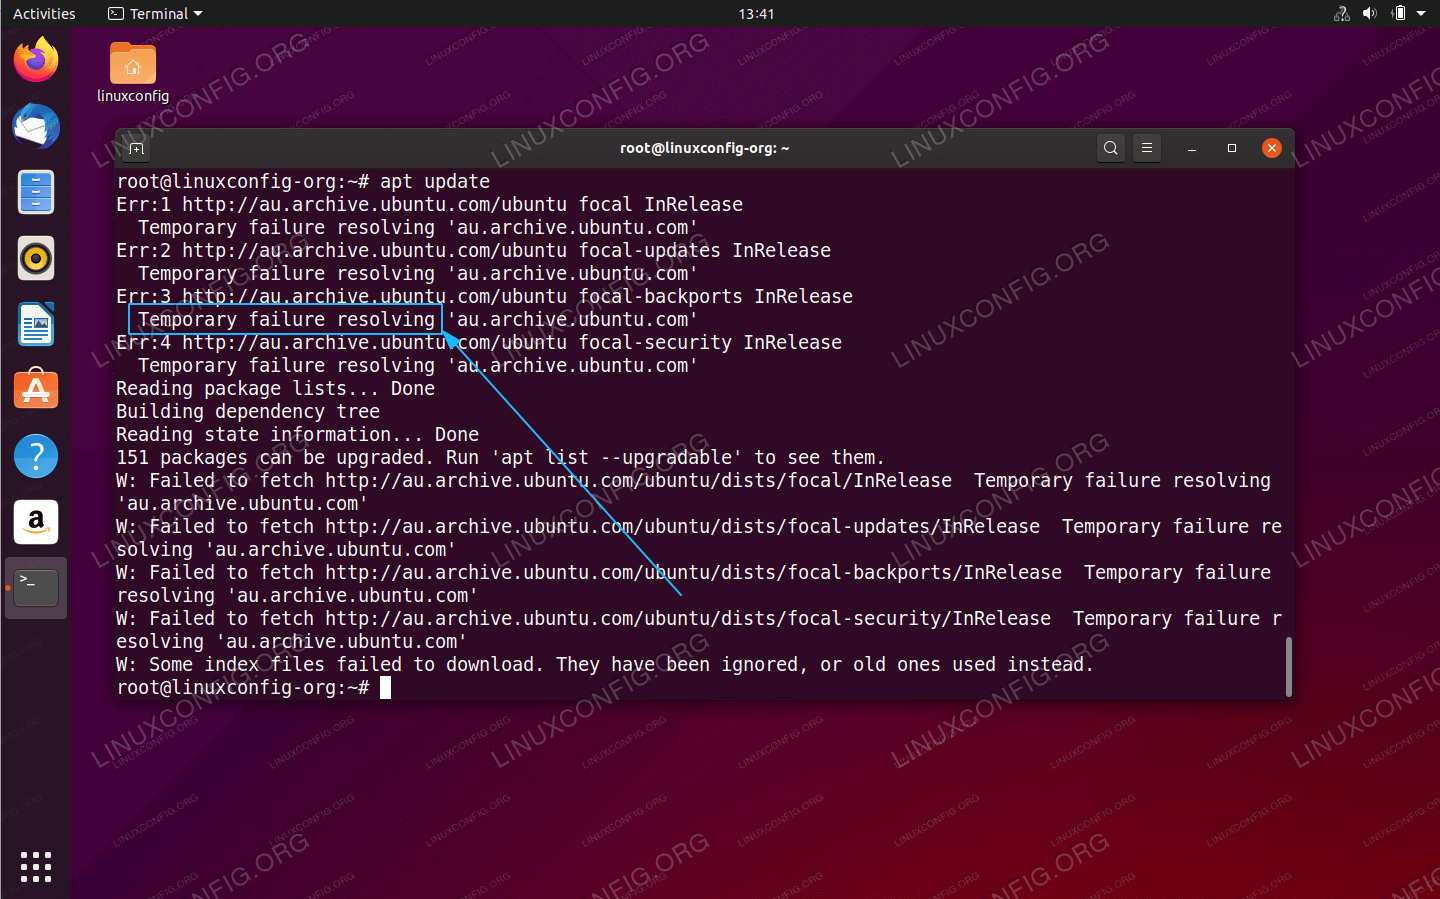
Finding a Failure in the Path
Use ping to quickly find where a failure exists in the network path. In
an instance, first see whether you can ping an external host, such as
google.com. If you can, then there shouldn’t be a network problem at
all.
![[errno -3] temporary failure in name resolution · issue #3677 · psf/requests · github](https://myeditor.ru/wp-content/uploads/0/f/f/0ff375f0b17e433d193dae1b36f535f8.png)
If you can’t, try pinging the IP address of the compute node where the
instance is hosted. If you can ping this IP, then the problem is
somewhere between the compute node and that compute node’s gateway.
If you can’t ping the IP address of the compute node, the problem is
between the instance and the compute node. This includes the bridge
connecting the compute node’s main NIC with the vnet NIC of the
instance.
Debugging DNS Issues
If you are able to use to log into an
instance, but it takes a very long time (on the order of a minute) to get
a prompt, then you might have a DNS issue. The reason a DNS issue can cause
this problem is that the SSH server does a reverse DNS lookup on the
IP address that you are connecting from. If DNS lookup isn’t working on your
instances, then you must wait for the DNS reverse lookup timeout to occur for
the SSH login process to complete.
When debugging DNS issues, start by making sure that the host where the
dnsmasq process for that instance runs is able to correctly resolve. If
the host cannot resolve, then the instances won’t be able to either.
A quick way to check whether DNS is working is to resolve a hostname
inside your instance by using the host command. If DNS is working,
you should see:
$ host openstack.org
openstack.org has address 174.143.194.225
openstack.org mail is handled by 10 mx1.emailsrvr.com.
openstack.org mail is handled by 20 mx2.emailsrvr.com.
If you’re running the Cirros image, it doesn’t have the “host” program
installed, in which case you can use ping to try to access a machine by
hostname to see whether it resolves. If DNS is working, the first line
of ping would be:
$ ping openstack.org
PING openstack.org (174.143.194.225): 56 data bytes
If the instance fails to resolve the hostname, you have a DNS problem.
For example:
$ ping openstack.org
ping: bad address 'openstack.org'
In an OpenStack cloud, the dnsmasq process acts as the DNS server for
the instances in addition to acting as the DHCP server. A misbehaving
dnsmasq process may be the source of DNS-related issues inside the
instance. As mentioned in the previous section, the simplest way to rule
out a misbehaving dnsmasq process is to kill all the dnsmasq processes
on the machine and restart . However, be aware that this
command affects everyone running instances on this node, including
tenants that have not seen the issue. As a last resort, as root:
# killall dnsmasq
# restart nova-network
After the dnsmasq processes start again, check whether DNS is working.
If restarting the dnsmasq process doesn’t fix the issue, you might need
to use to look at the packets to trace where the failure is.
The DNS server listens on UDP port 53. You should see the DNS request on
the bridge (such as, br100) of your compute node. Let’s say you start
listening with on the compute node:
# tcpdump -i br100 -n -v udp port 53
tcpdump: listening on br100, link-type EN10MB (Ethernet), capture size 65535 bytes
Then, if you use SSH to log into your instance and try ,
you should see something like:
Short description
To decrease CPU and network usage and avoid DNS resolution failures, apply a DNS cache.
When you use a DNS cache to query external DNS resources, such as one of the following AWS applications, the cache answers most of the recurring DNS queries locally without interacting with the DNS resolver over the network:
- Amazon Relational Database Service (Amazon RDS)
- Amazon ElastiCache
- Amazon Simple Storage Service (Amazon S3)
The following procedure applies to all versions of Amazon Linux. If you’re using another distribution, select the documentation for your distribution from the following list:
- For Debian, see on the debian.org website.
- For Ubuntu, see on the Ubuntu website.
- For RHEL, see How to configure DNS caching server with dnsmasq in RHEL on the Red Hat customer portal.
Missing DNS Server IPs
Every server needs IP of DNS servers to which they can send their DNS queries. So if IPs of DNS servers are not configured then your server doesn’t know how to resolve domain names to IP Address thus you will end up getting temporary failure in name resolution.
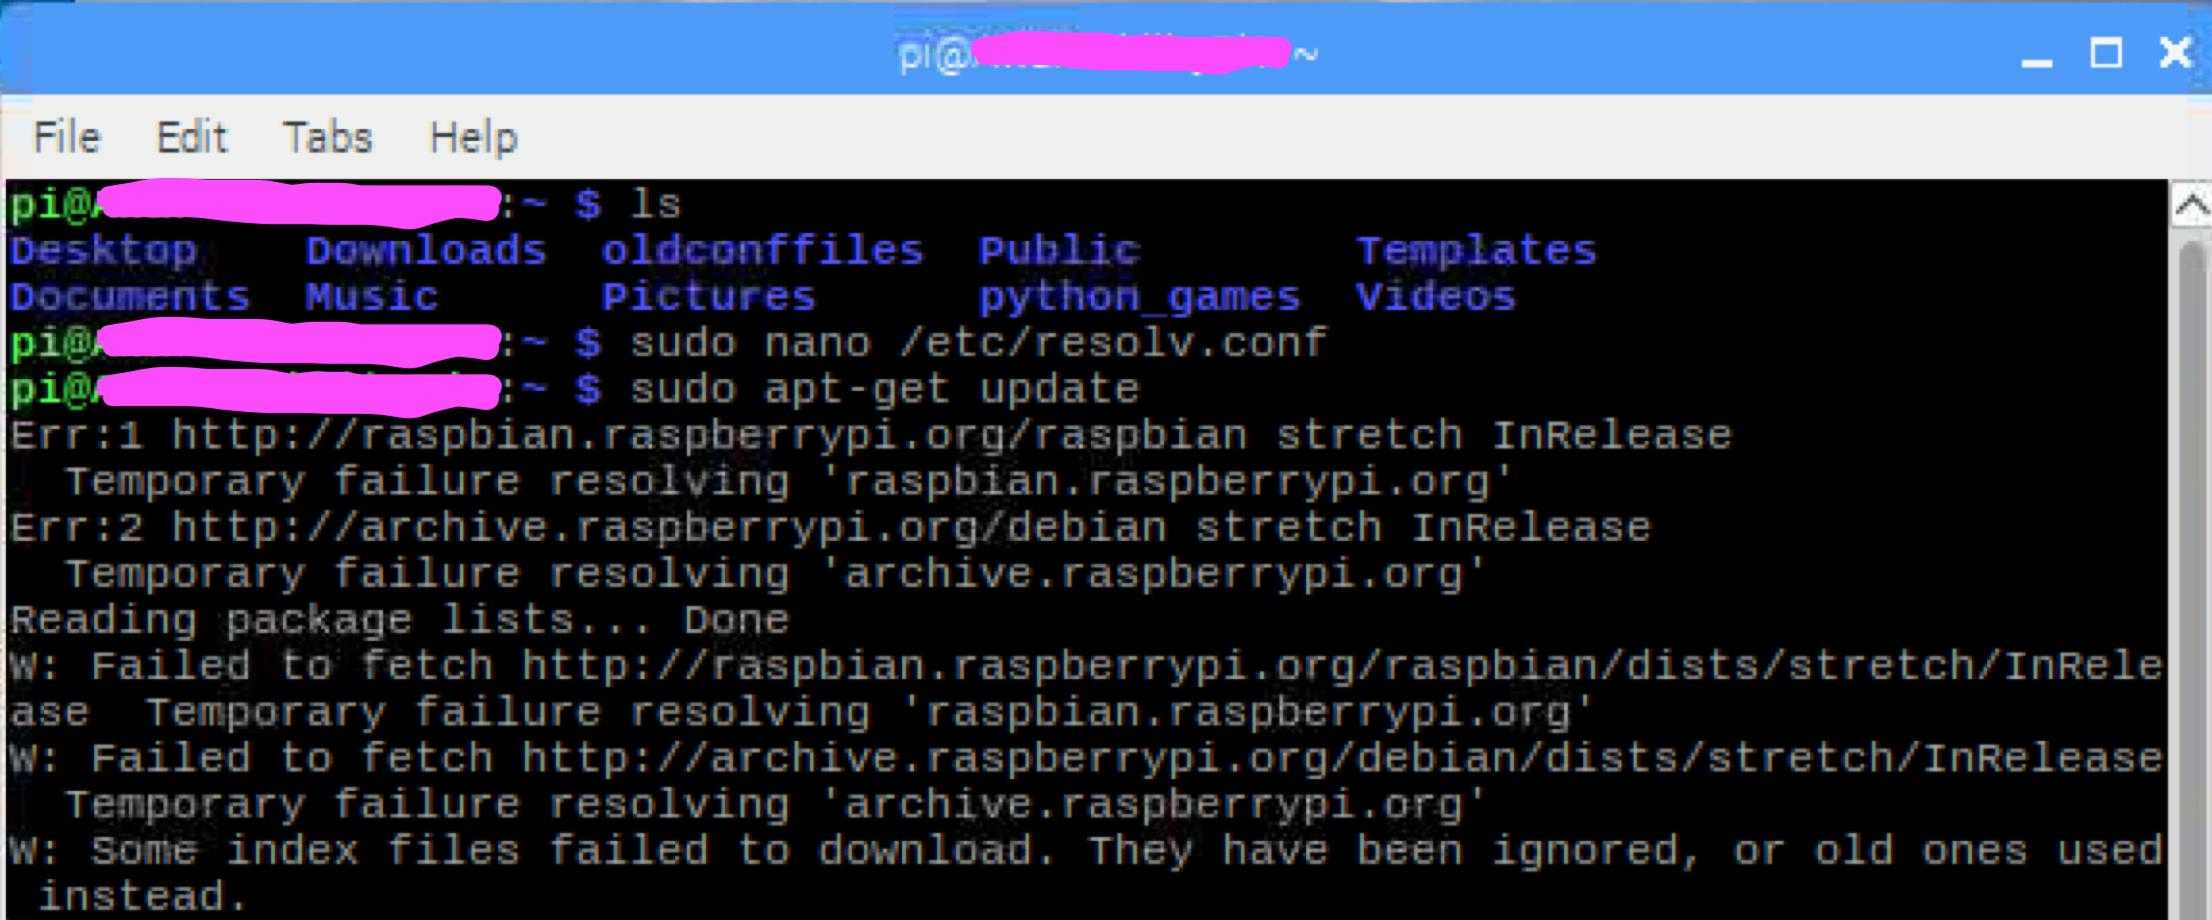
In UNIX based system (Linux servers). DNS servers are usually configured in a file called /etc/resolv.conf. So if you don’t have this file or it is empty then you can not resolve domain names, make sure to create one and put the following contents in it:
Network Manager
Recently most of the Linux based servers are shipped with NetworkManager. NetworkManager help your connect your server automatically to the internet, for this task network manager auto-generates some configuration files. NetworkManager reads your interface file (eth0 or ifcfg) and then auto-generates /etc/resolv.conf file.
Now if you have not defined DNS servers in your /etc/sysconfig/network-scripts file, then /etc/resolv.conf will remain empty, thus you end up getting temporary failure in name resolution error. You can also fix this issue by just populating /etc/resolv.conf file as described above.
Also, make sure that in your /etc/sysconfig/network-scripts file set NM_CONTROLLED=no. So that NetworkManager will not update your /etc/resolv.conf file again.
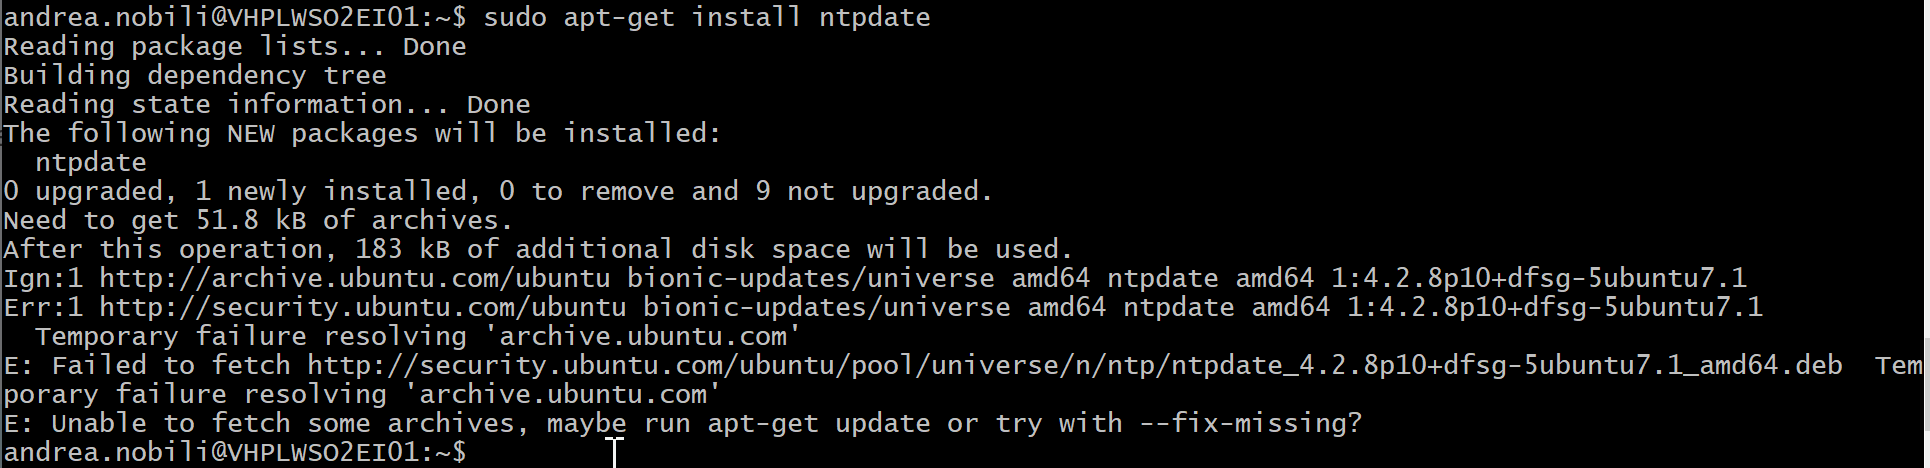
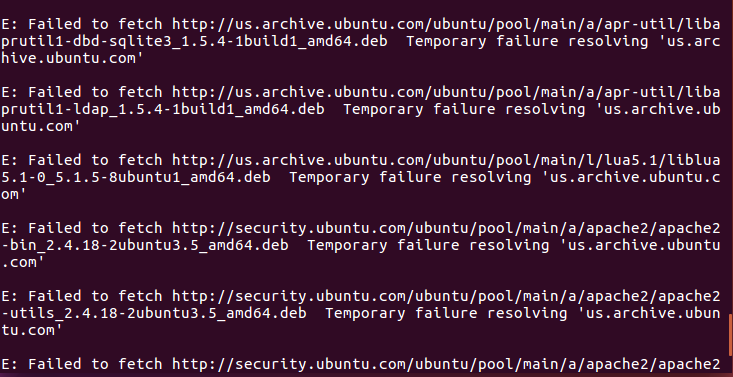
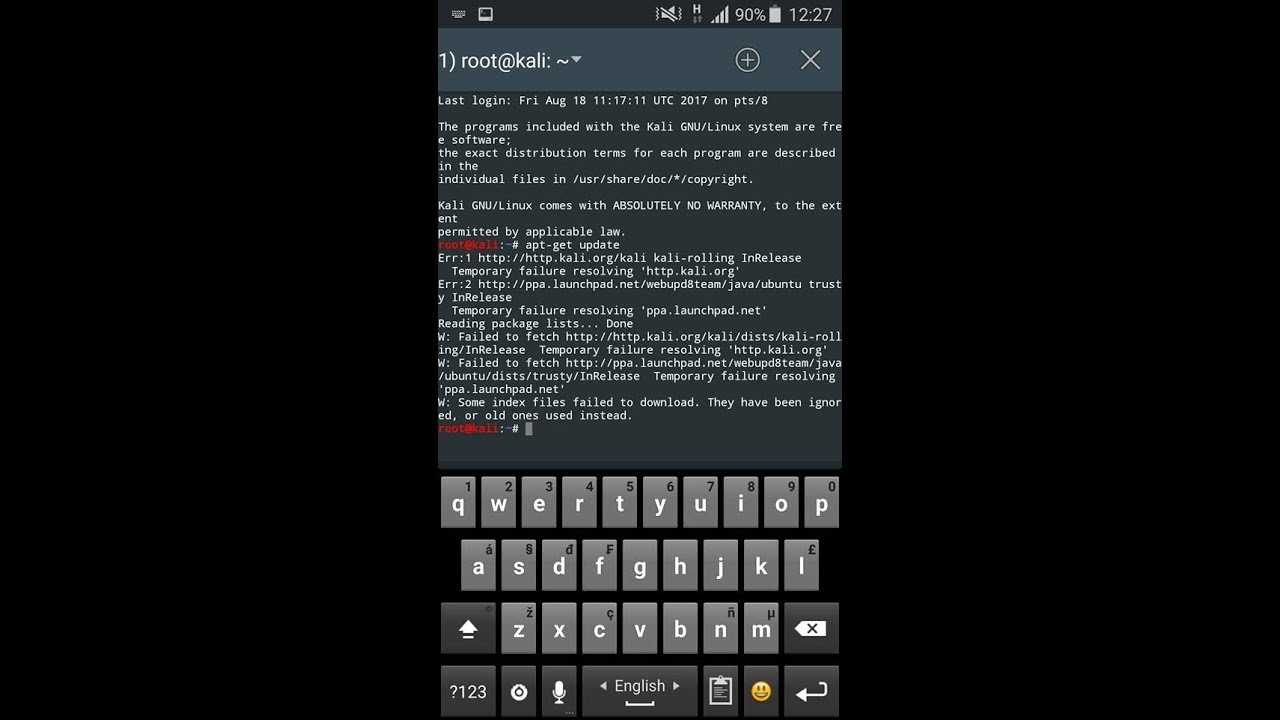
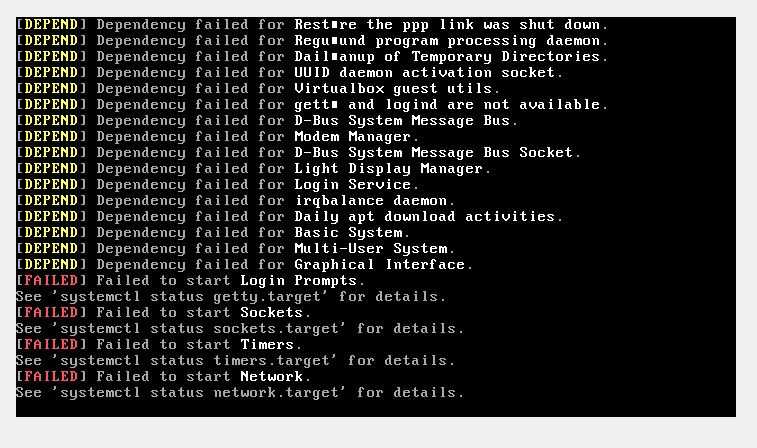
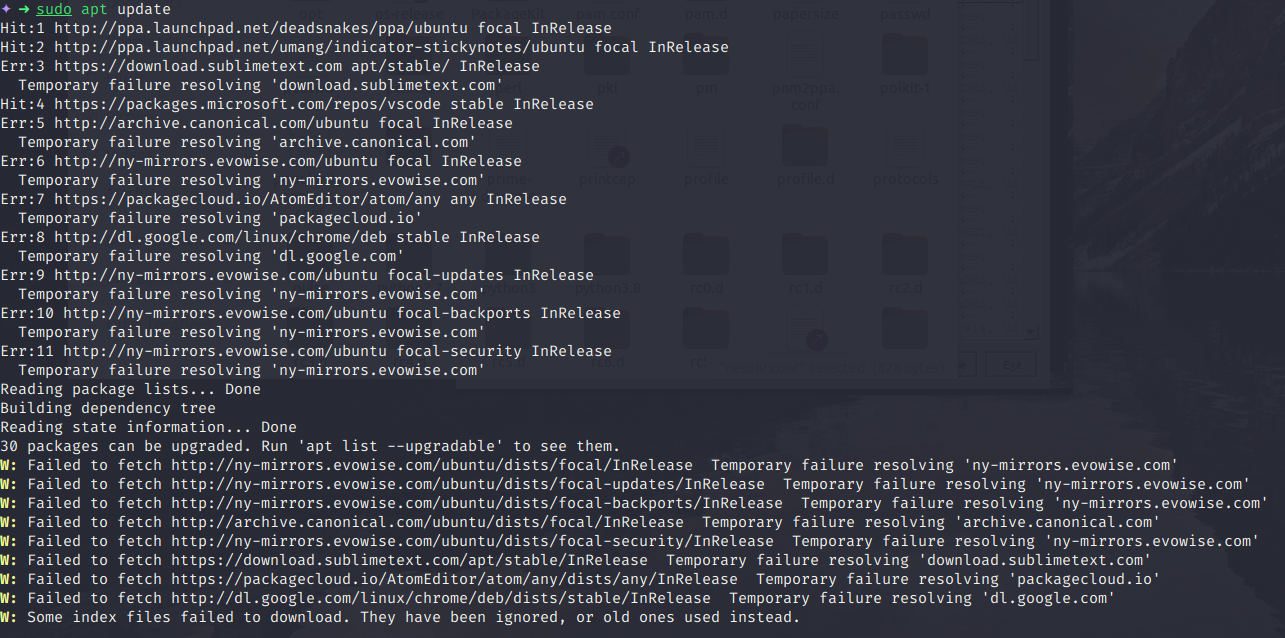
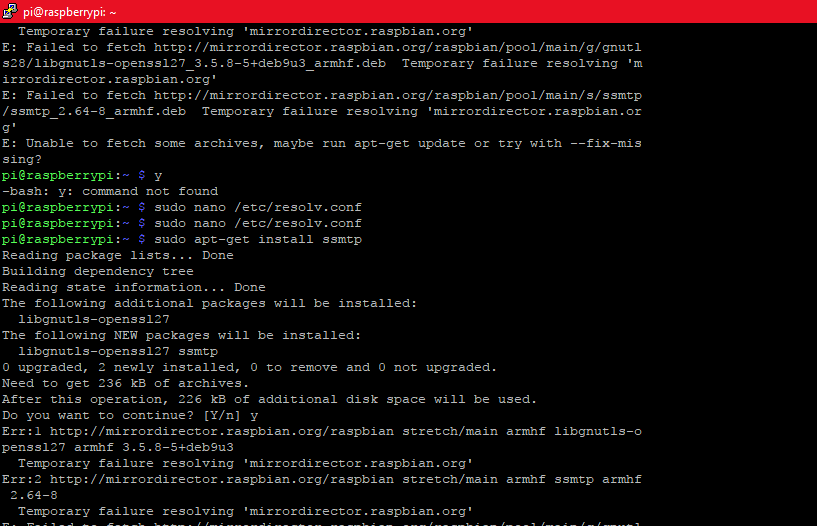
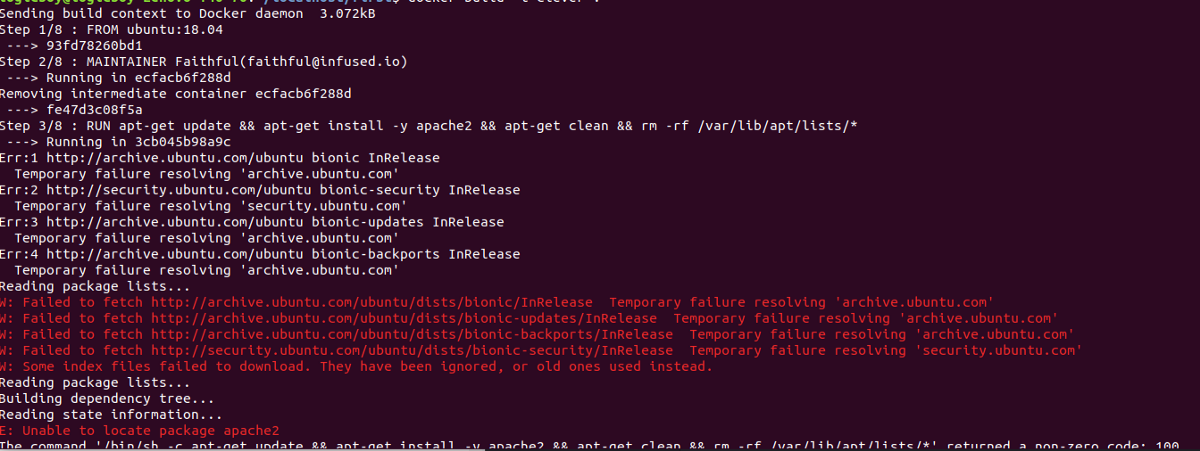
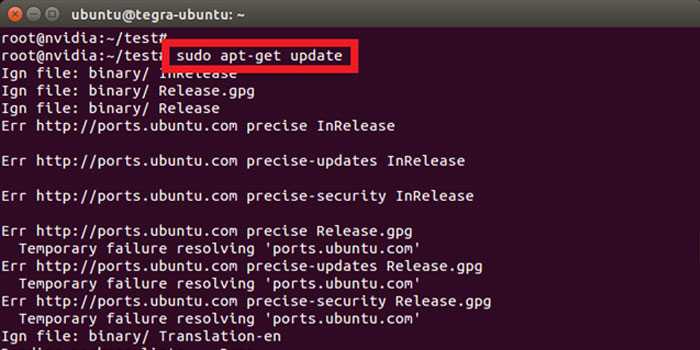
This is an example of temporary failure in name resolution error, as apt can not resolve these mentioned domains to their IP Address. Make sure to allow these ports in UFW using the command below :
iptables
Through or , OpenStack Compute automatically
manages iptables, including forwarding packets to and from instances on
a compute node, forwarding floating IP traffic, and managing security
group rules. In addition to managing the rules, comments (if supported)
will be inserted in the rules to help indicate the purpose of the rule.
The following comments are added to the rule set as appropriate:
-
Perform source NAT on outgoing traffic.
-
Default drop rule for unmatched traffic.
-
Direct traffic from the VM interface to the security group chain.
-
Jump to the VM specific chain.
-
Direct incoming traffic from VM to the security group chain.
-
Allow traffic from defined IP/MAC pairs.
-
Drop traffic without an IP/MAC allow rule.
-
Allow DHCP client traffic.
-
Prevent DHCP Spoofing by VM.
-
Send unmatched traffic to the fallback chain.
-
Drop packets that are not associated with a state.
-
Direct packets associated with a known session to the RETURN chain.
-
Allow IPv6 ICMP traffic to allow RA packets.
Run the following command to view the current iptables configuration:
# iptables-save
Visualizing OpenStack Networking Service Traffic in the Cloud
OpenStack Networking has many more degrees of freedom than
does because of its pluggable back end. It can be
configured with open source or vendor proprietary plug-ins that control
software defined networking (SDN) hardware or plug-ins that use Linux
native facilities on your hosts, such as Open vSwitch or Linux Bridge.
The networking chapter of the OpenStack Administrator
Guide
shows a variety of networking scenarios and their connection paths. The
purpose of this section is to give you the tools to troubleshoot the
various components involved however they are plumbed together in your
environment.
For this example, we will use the Open vSwitch (OVS) back end. Other
back-end plug-ins will have very different flow paths. OVS is the most
popularly deployed network driver, according to the April 2016
OpenStack User Survey. We’ll describe each step in turn, with
for reference.
Visualizing nova-network Traffic in the Cloud
If you are logged in to an instance and ping an external host, for
example, Google, the ping packet takes the route shown in
.
![]()
Figure. Traffic route for ping packet
-
The instance generates a packet and places it on the virtual Network
Interface Card (NIC) inside the instance, such as . -
The packet transfers to the virtual NIC of the compute host, such as,
. You can find out what vnet NIC is being used by looking at
the file. -
From the vnet NIC, the packet transfers to a bridge on the compute
node, such as .If you run FlatDHCPManager, one bridge is on the compute node. If you
run VlanManager, one bridge exists for each VLAN.To see which bridge the packet will use, run the command:
$ brctl show
Look for the vnet NIC. You can also reference and look
for the option. -
The packet transfers to the main NIC of the compute node. You can
also see this NIC in the brctl output, or you can find it by
referencing the option in . -
After the packet is on this NIC, it transfers to the compute node’s
default gateway. The packet is now most likely out of your control at
this point. The diagram depicts an external gateway. However, in the
default configuration with multi-host, the compute host is the
gateway.