Deployment — деплой в кластер
Переходим к следующей абстракции Kubernetes — Deployment. Они управляют наборами replicaset для непрерывного обновления подов. Покажу на примере, о чем идет речь. Допустим, у вас вышло обновление приложения в новом контейнере. Вам нужно не останавливая сервис выкатить обновление в прод. Если вы измените версию контейнера в шаблоне replicaset, автоматически он у вас не обновится. Да, если pod со старой версией контейнера упадет, новый будет создан уже с новой версией. Но все работающие поды останутся на старой версии.
Deployment как раз и нужен для управления репликасетами, задавая им стратегию обновления. У вас вышла новая версия контейнера, вы заменяете в текущем deployment версию контейнера и он по заранее настроенным правилам начинает перезапуск репликасетов и соответственно подов в них. Покажу на примере nginx, который мы откатим на предыдущую версию. Создаем yaml файл с deployment.
---
apiVersion: apps/v1
kind: Deployment
metadata:
  name: deployment-nginx
spec:
  replicas: 2
  selector:
    matchLabels:
      app: my-nginx
  strategy:
    rollingUpdate:
      maxSurge: 1
      maxUnavailable: 1
    type: RollingUpdate
  template:
    metadata:
      labels:
        app: my-nginx
    spec:
      containers:
      - image: nginx:1.16
        name: nginx
        ports:
        - containerPort: 80
Запускаем его.
# kubectl apply -f deployment-nginx.yaml
deployment.apps/deployment-nginx created
Смотрим список подов и репликасетов.
# kubectl get pod
NAME                                READY   STATUS    RESTARTS   AGE
deployment-nginx-785b6d8d9f-dr4cv   1/1     Running   0          55s
deployment-nginx-785b6d8d9f-m47tr   1/1     Running   0          55s
# kubectl get rs
NAME                          DESIRED   CURRENT   READY   AGE
deployment-nginx-785b6d8d9f   2         2         2       58s
Проверяем версию nginx в одном из подов.
# kubectl describe pod deployment-nginx-785b6d8d9f-dr4cv
![]()
Теперь откатимся на предыдущую версию nginx 1.15. Для этого вносим изменения в Deployment.
# kubectl set image deployment deployment-nginx nginx=nginx:1.15
Проверяем список подов и репликасетов.
# kubectl get pod
NAME                                READY   STATUS    RESTARTS   AGE
deployment-nginx-68d778658b-fz5lt   1/1     Running   0          11s
deployment-nginx-68d778658b-mpkg5   1/1     Running   0          10s
# kubectl get rs
NAME                          DESIRED   CURRENT   READY   AGE
deployment-nginx-68d778658b   2         2         2       15s
deployment-nginx-785b6d8d9f   0         0         0       5m57s
Название подов и репликасета изменились. Появился новый replicaset, а старый остался с погашенными подами, у него параметр replicas стал 0. Проверяем версию nginx в поде.
# kubectl describe pod deployment-nginx-68d778658b-fz5lt
![]()
Версия nginx изменилась во всех подах. Стратегия обновления описана в шаблоне деплоймента в разделе strategy. В данном случае используется тип RollingUpdate, когда deployment постепенно уменьшает количество реплик старой версии и увеличивает реплики новой версии, пока они все не заменят старые. При этом replicaset с предыдущей версией контейнера осталась. Она не удаляется для того, чтобы можно было потом оперативно вернуться на предыдущую версию, если с новой будет что-то не так. Для этого достаточно будет по очереди погасить поды новой replicaset и запустить старые. Делается это следующим образом.
# kubectl rollout undo deployment deployment-nginx
deployment.extensions/deployment-nginx rolled back
Проверяем наши replicaset.
# kubectl get rs
NAME                          DESIRED   CURRENT   READY   AGE
deployment-nginx-68d778658b   0         0         0       12m
deployment-nginx-785b6d8d9f   2         2         2       18m
Видим, что был снова запущен предыдущий replicaset с прошлой версией контейнера. По-умолчанию хранятся 10 версий прошлых replicaset.
Мониторинг и Kubernetes (обзор и видео доклада) +26
- 08.06.18 06:05
•
distol
•
#412901
•
Хабрахабр
•
•
3600
Системное администрирование, Серверное администрирование, DevOps, Блог компании Флант
![]()
![]()
28 мая на проходившей в рамках фестиваля РИТ++ 2018 конференции RootConf 2018, в секции «Логирование и мониторинг», прозвучал доклад «Мониторинг и Kubernetes». В нём рассказывается об опыте настройки мониторинга с Prometheus, который был получен компанией «Флант» в результате эксплуатации десятков проектов на Kubernetes в production.
По традиции рады представить видео с докладом (около часа, гораздо информативнее статьи) и основную выжимку в текстовом виде. Поехали!
Настройка и развертывание ConfigMaps в Azure Red Hat OpenShift версии 3
В этом разделе описаны требования и действия для успешной настройки файла конфигурации ConfigMap для кластера Azure Red Hat OpenShift версии 3.x.
Примечание
Для Azure Red Hat OpenShift версии 3.x в пространстве имен openshift-azure-logging создается файл шаблона ConfigMap. Он не настроен на активный сбор метрик или сбор данных от агента.
Предварительные требования
Прежде чем начать, убедитесь, что вы являетесь участником кластера Azure Red Hat OpenShift с ролью администратора пользовательского кластера, что позволяет настраивать параметры контейнерного агента и сбора метрик Prometheus. Чтобы убедиться, что вы являетесь участником группы osa-customer-admins, выполните следующую команду:
Результат должен выглядеть так:
Участник группы osa-customer-admins может внести в список ConfigMap с помощью следующей команды:
Результат должен выглядеть так:
Включение мониторинга
Выполните следующие действия, чтобы настроить файл конфигурации ConfigMap для кластера Azure Red Hat OpenShift версии 3.x.
-
Чтобы собирать метрики Prometheus, измените yaml-файл ConfigMap, дополнив настройки. Шаблон ConfigMap уже существует в кластере Red Hat OpenShift версии 3. Выполните команду , чтобы открыть файл в текстовом редакторе.
Примечание
Заметку надо добавить в метаданные container-azm-ms-agentconfig ConfigMap для предотвращения сверки.
-
Для сбора из служб Kubernetes на уровне кластера, настройте файл ConfigMap, используя следующий пример.
-
Чтобы настроить сбор метрик Prometheus по определенному URL-адресу в кластере, настройте файл ConfigMap, используя следующий пример.
-
Чтобы настроить сбор метрик Prometheus из DaemonSet агента для каждого отдельного узла в кластере, настройте следующие параметры в ConfigMap:
Примечание
$NODE_IP — это конкретный параметр для аналитики контейнеров, который можно использовать вместо IP-адреса узла. Необходимо использовать прописные буквы.
-
Чтобы настроить сбор метрик Prometheus, указав заметку pod, выполните действия, описанные ниже.
-
В ConfigMap укажите следующее:
-
Укажите следующую конфигурацию для заметок pod:
Чтобы ограничить мониторинг до определенных пространств имен для объектов pod с заметками, например включайте только объекты pod, выделенные для рабочих нагрузок, установите для параметра значение в ConfigMap и добавьте фильтр пространства имен , указывающий пространства имен, для которых следует выполнять сбор данных. Например .
-
-
-
Сохраните изменения в редакторе.
Для вступления в силу изменений конфигурации может потребоваться несколько минут, и все omsagent объектов pod в кластере будут перезапущены. Перезапуск выполняется как пошаговый перезапуск для всех omsagent объектов pod, а не как одновременный перезапуск. По завершении перезапусков появится сообщение, подобное приведенному ниже, с таким результатом: .
Обновленный ConfigMap можно просмотреть, выполнив команду .
ConfigMap Reloader
Because we will do a lot of changes to the of our future Prometheus — worth to add the Reloader now, so pods will apply those changes immediately without our intervention.
Create a directory:
$ mkdir -p roles/reloader/tasks
And only one task there — the Reloader installation. Will use , and call it with the Ansible module.
In the add the following:
- name: "Install Reloader" command: "kubectl apply -f https://raw.githubusercontent.com/stakater/Reloader/master/deployments/kubernetes/reloader.yaml"
Enough for now — I just have no time to dig into and its issues with the import.
Add this role to a playbook:
- hosts: - all become: true roles: - role: cloudformation tags: infra - role: eksctl tags: eks - role: reloader tags: reloader
Run:
$ ansible-playbook eks-cluster.yml --tags reloader
And check:
The prometheus.yml ConfigMap
As already mentioned, the Prometheus config data will be kept in a .
Create a new file called — this is a minimal configuration:
---apiVersion: v1kind: ConfigMapmetadata: name: prometheus-config namespace: monitoringdata: prometheus.yml: | global: scrape_interval: 15s external_labels: monitor: 'eks-dev-monitor' scrape_configs: - job_name: 'prometheus' scrape_interval: 5s static_configs: - targets:
Add it to the :
- name: "Create the Monitoring Namespace" command: "kubectl apply -f roles/monitoring/templates/prometheus-ns.yml.j2"- name: "Create prometheus.yml ConfigMap" command: "kubectl apply -f roles/monitoring/templates/prometheus-configmap.yml.j2"
Now can check one more time — apply it up and check the content:
kubewatch
Как следует из названия, kubewatch отслеживает определенные события Kubernetes и отправляет уведомления об этих событиях на различные конечные точки, такие как Slack и PagerDuty. В частности, kubewatch будет искать изменения, внесенные в определенные ресурсы Kubernetes, за которыми вы просите его следить — наборы демонов, развертывания, поды, наборы реплик, контроллеры репликации, службы, секреты и карты конфигурации. kubewatch легко настроить, и его можно развернуть с помощью Helm или настраиваемого развертывания.
Плюсы : поддерживает несколько конечных точек, легко развертывается.
Минусы : просто наблюдатель
How to monitor a Kubernetes service with Prometheus
Prometheus metrics are exposed by services through HTTP(S), and there are several advantages of this approach compared to other similar monitoring solutions:
- You don’t need to install a service agent, just expose a web port. Prometheus servers will regularly scrape (pull), so you don’t need to worry about pushing metrics or configuring a remote endpoint either.
- Several microservices already use HTTP for their regular functionality, and you can reuse that internal web server and just add a folder like /metrics.
- The metrics format itself is human-readable and easy to grasp. If you are the maintainer of the microservice code, you can start publishing metrics without much complexity or learning required.
Some services are designed to expose Prometheus metrics from the ground up (the Kubernetes kubelet, Traefik web proxy, Istio microservice mesh, etc.). Other services are not natively integrated but can be easily adapted using an exporter. An exporter is a service that collects service stats and “translates” them to Prometheus metrics ready to be scraped. There are examples of both in this guide.
Let’s start with the best case scenario: the microservice that you are deploying already offers a Prometheus endpoint.
Traefik is a reverse proxy designed to be tightly integrated with microservices and containers. A common use case for Traefik is as an Ingress controller or Entrypoint. This is the bridge between the Internet and the specific microservices inside your cluster.
You have several options to install Traefik and a Kubernetes-specific install guide. If you just want a simple Traefik deployment with Prometheus support up and running quickly, use the following commands:
helm repo add stable https://kubernetes-charts.storage.googleapis.com/
helm install traefik stable/traefik --set metrics.prometheus.enabled=true
Once the Traefik pods are running, you can display the service IP:
$ kubectl get svc
k get svc
NAME         TYPE            CLUSTER-IP       EXTERNAL-IP                                                               PORT(S)                     AGE
kubernetes  ClusterIP        100.64.0.1       <none>                                                                    443/TCP                     99d
traefik    LoadBalancer      100.65.9.227 xxx.eu-west-1.elb.amazonaws.com   443:32164/TCP,80:31829/TCP  72m
traefik-prometheus ClusterIP 100.66.30.208    <none>                                                                    9100/TCP                    72m
You can check that the Prometheus metrics are being exposed in the service by just using curl from a shell in any container:
$ curl 100.66.30.208:9100/metrics
# HELP go_gc_duration_seconds A summary of the GC invocation durations.
# TYPE go_gc_duration_seconds summary
go_gc_duration_seconds{quantile="0"} 2.4895e-05
go_gc_duration_seconds{quantile="0.25"} 4.4988e-05
...
Now, you need to add the new target to the conf file. Check it with the command:
kubectl get cm prometheus-server -o yaml
You will notice that Prometheus automatically scrapes itself:
  - job_name: 'prometheus'
    # metrics_path defaults to '/metrics'
    # scheme defaults to 'http'.
    static_configs:
    - targets:
Let’s add another static endpoint.
Edit the file with the command:
kubectl edit cm prometheus-server
And add this new job:
  - job_name: 'traefik'
    static_configs:
    - targets:
If the service is in a different namespace, you need to use the FQDN (e.g., )
Of course, this is a bare-minimum configuration and the supports multiple parameters.
To name a few:
- and : Your endpoints may require authentication over HTTPS, using a classical login/password scheme or a bearer token in the request headers.
- or : Different endpoint autodiscovery methods.
- , , : Different tradeoffs between precision, resilience, and system load.
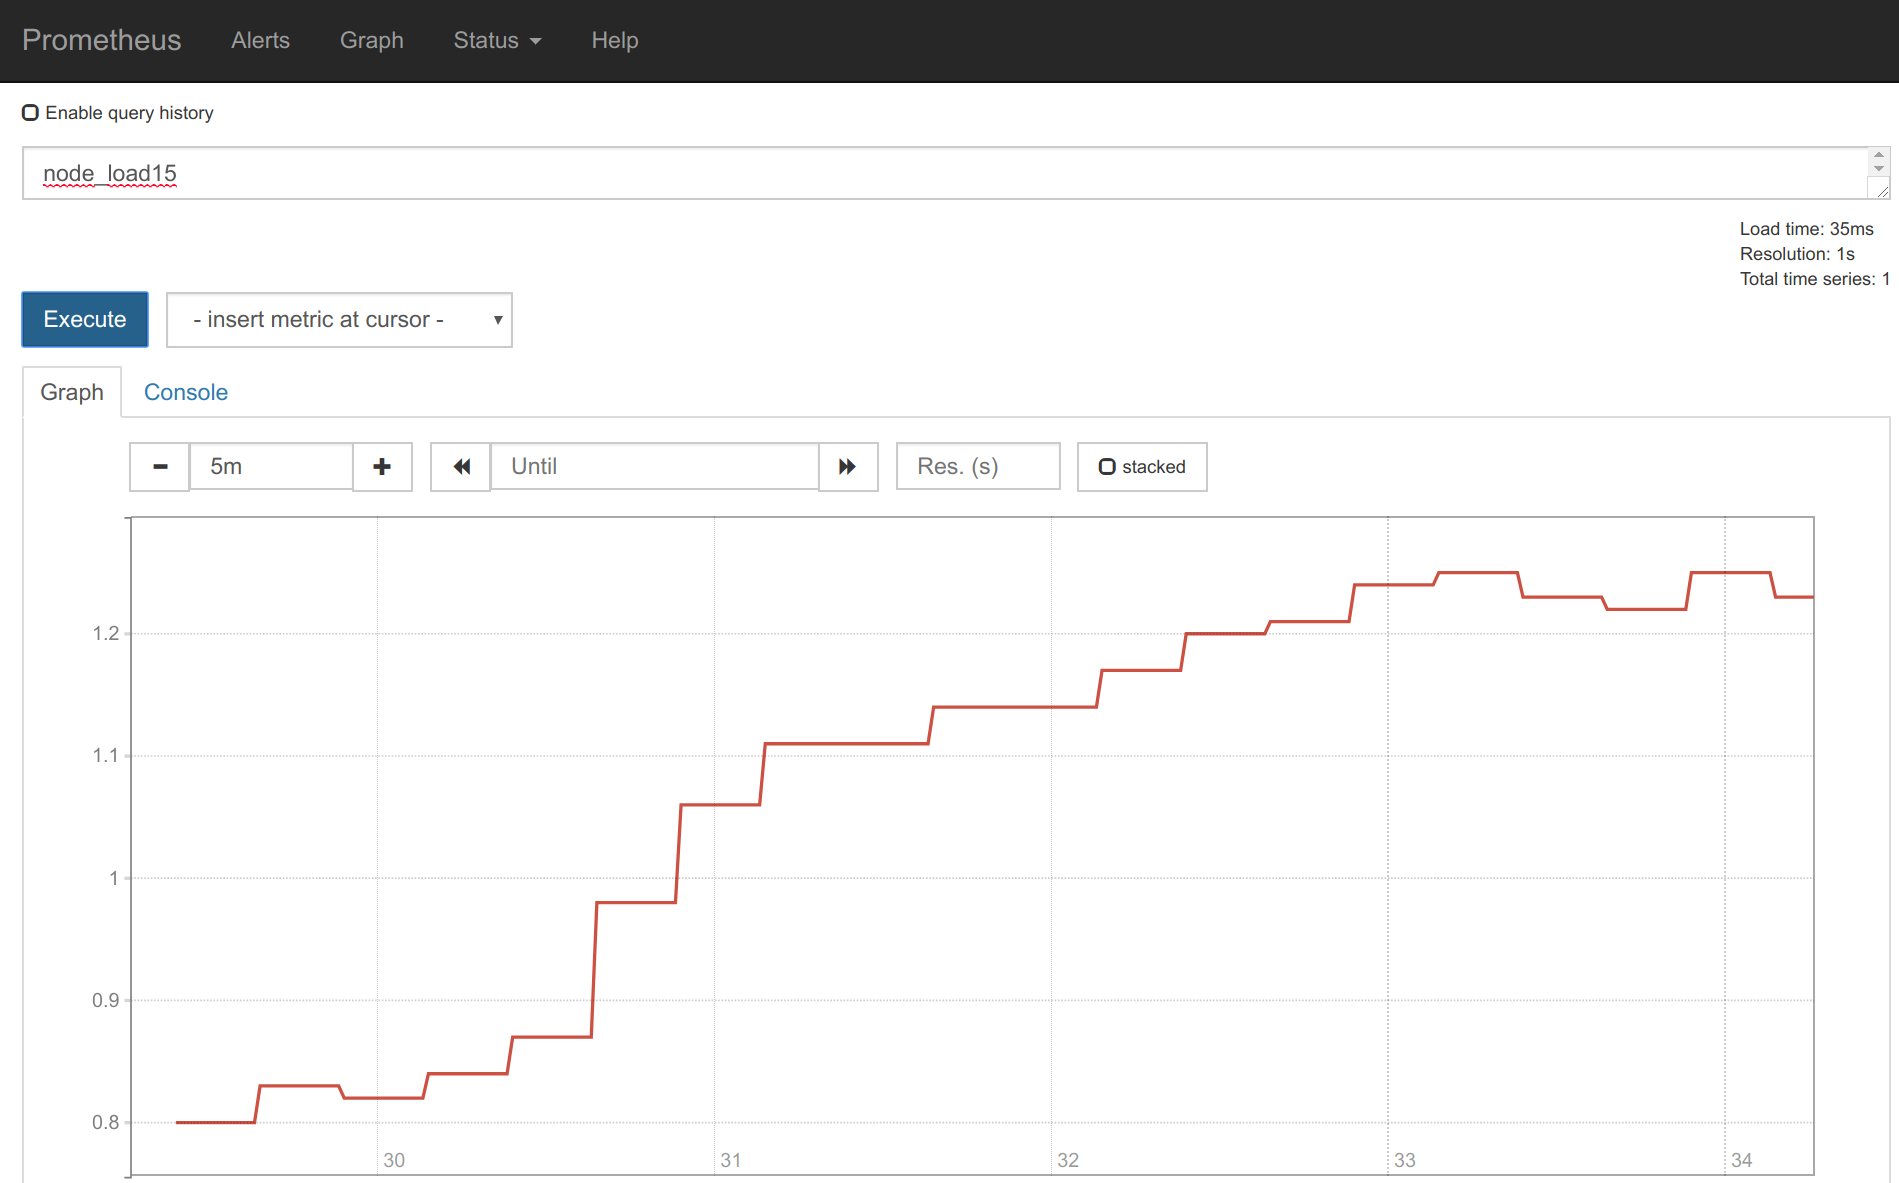
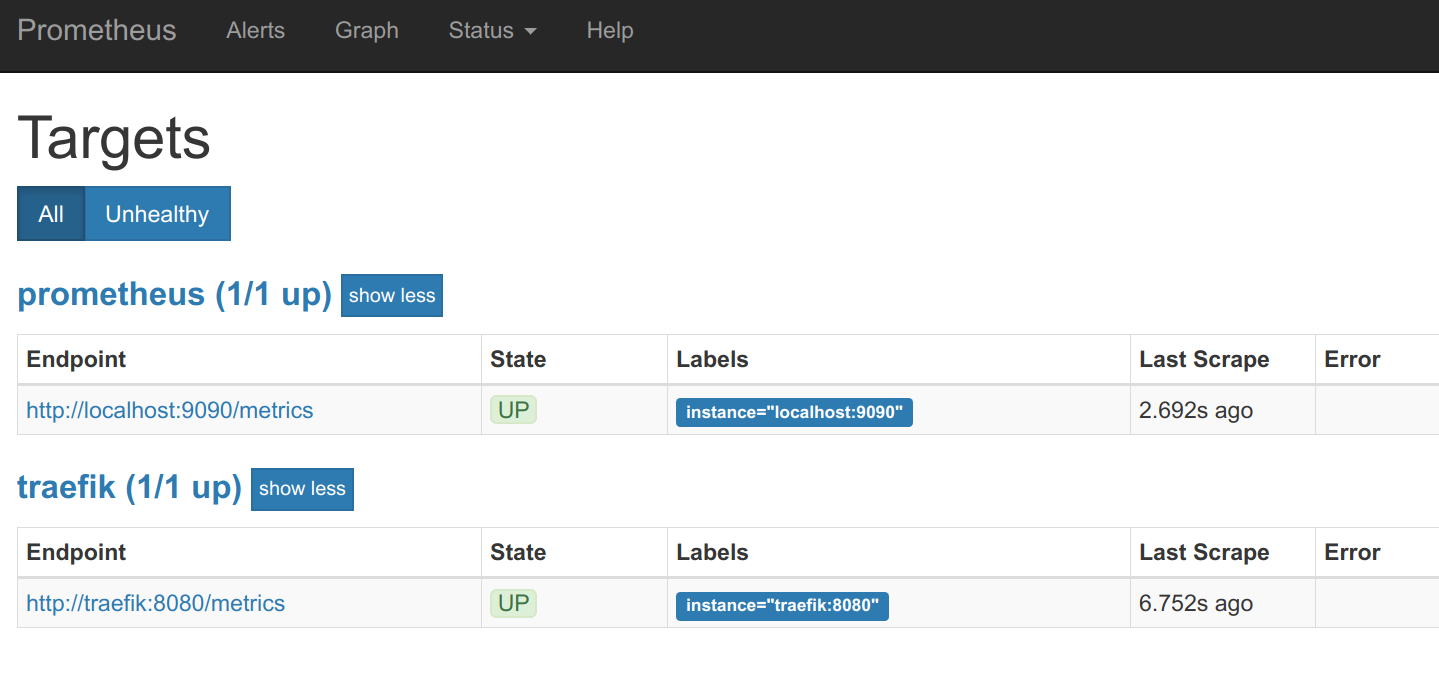
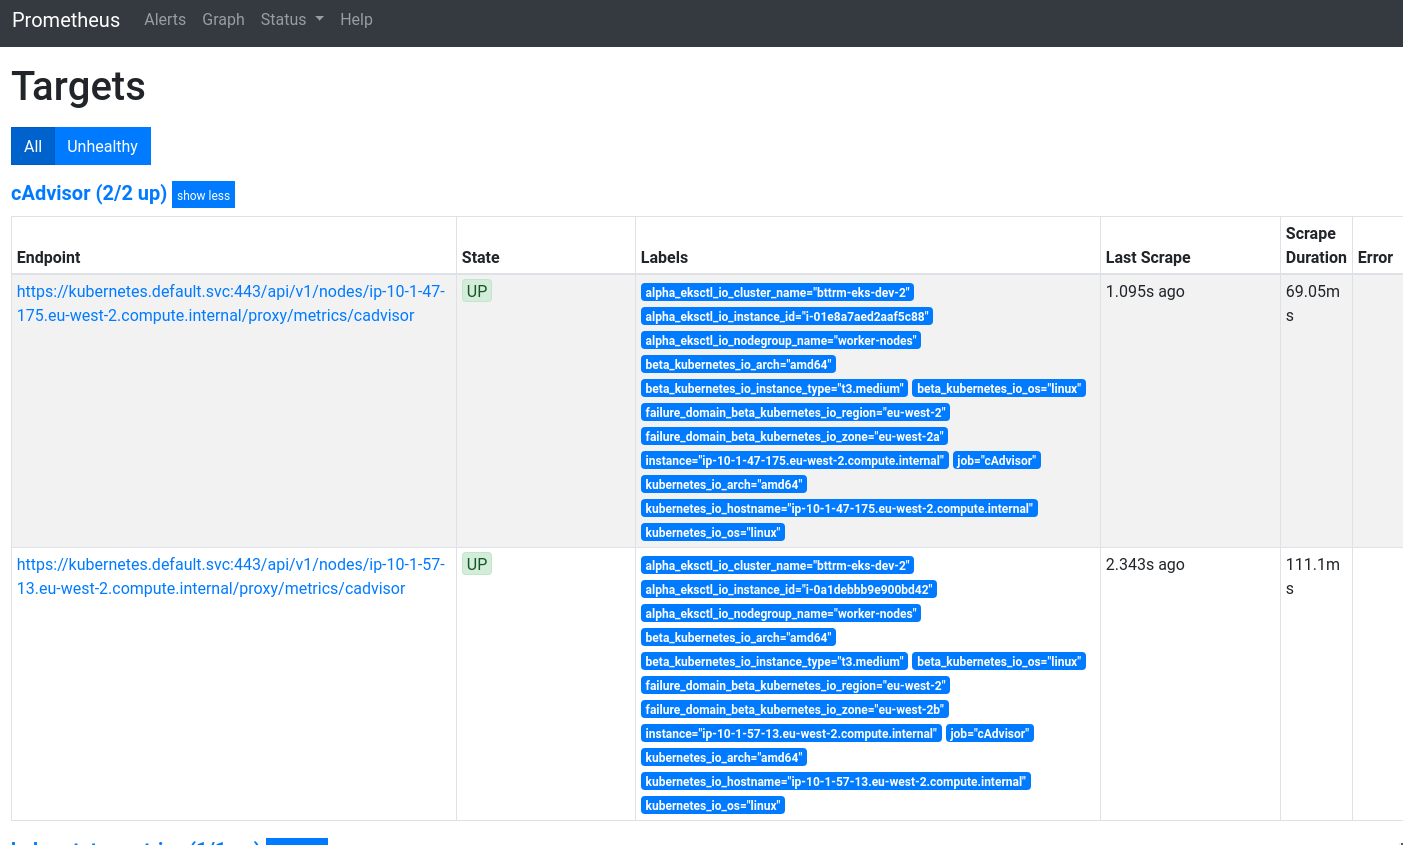
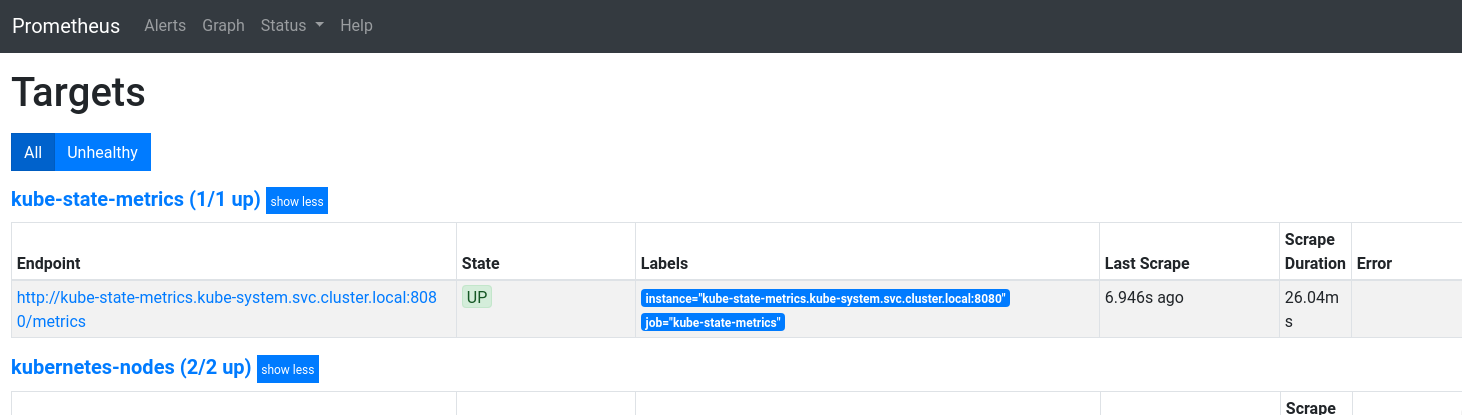
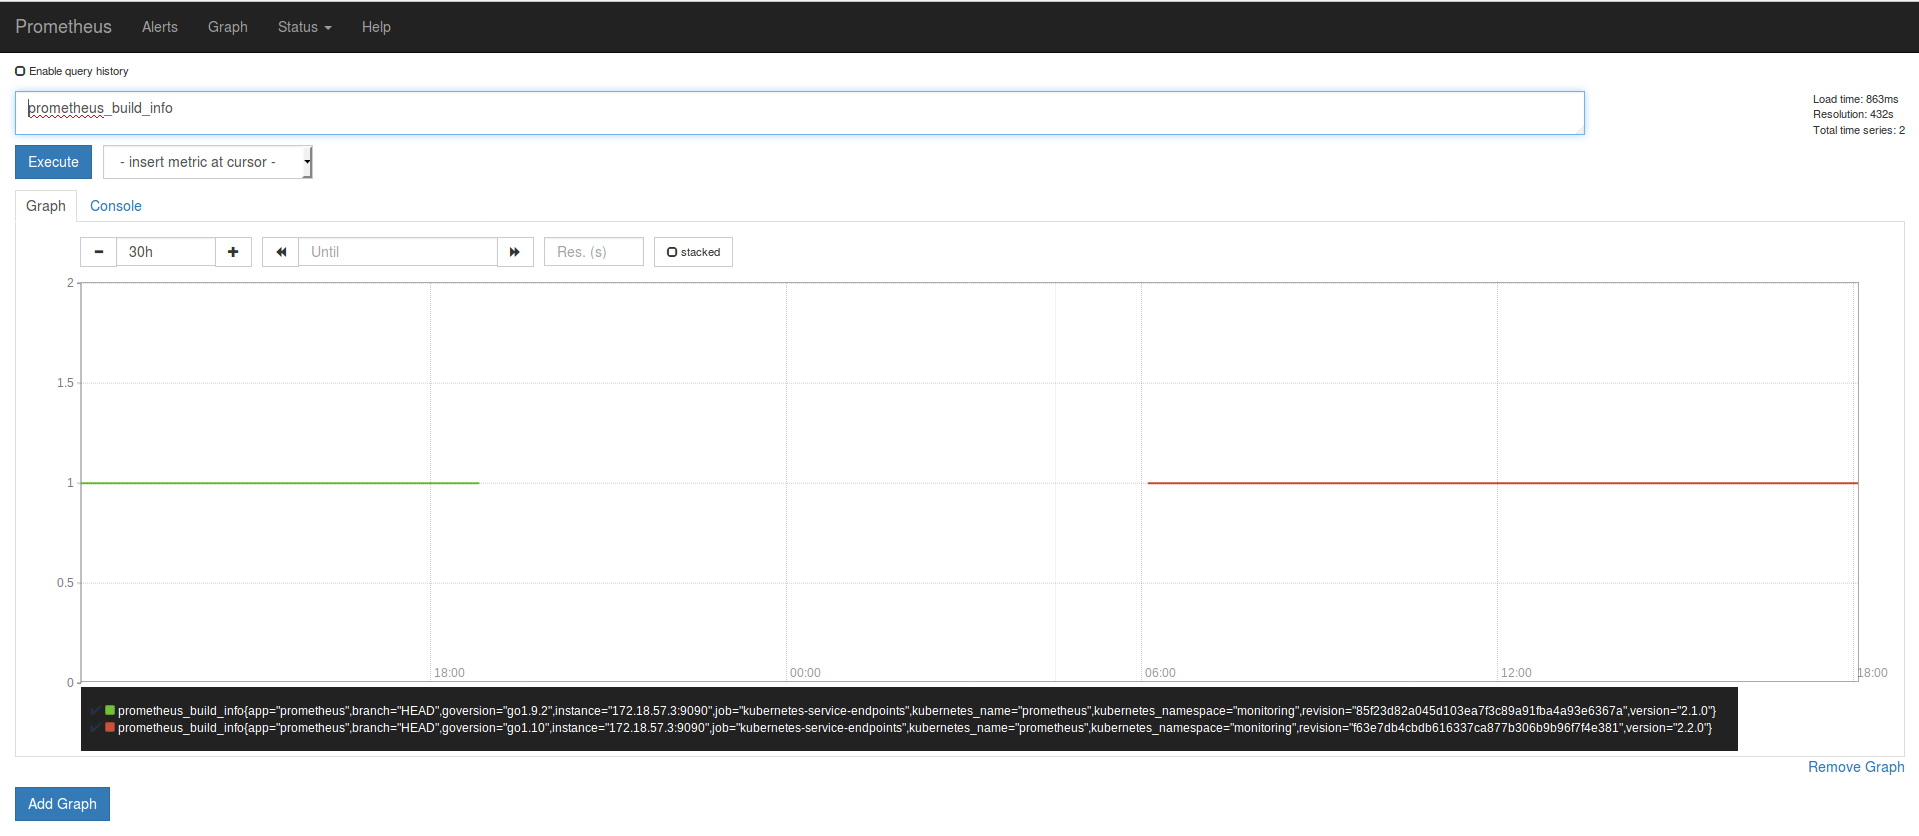
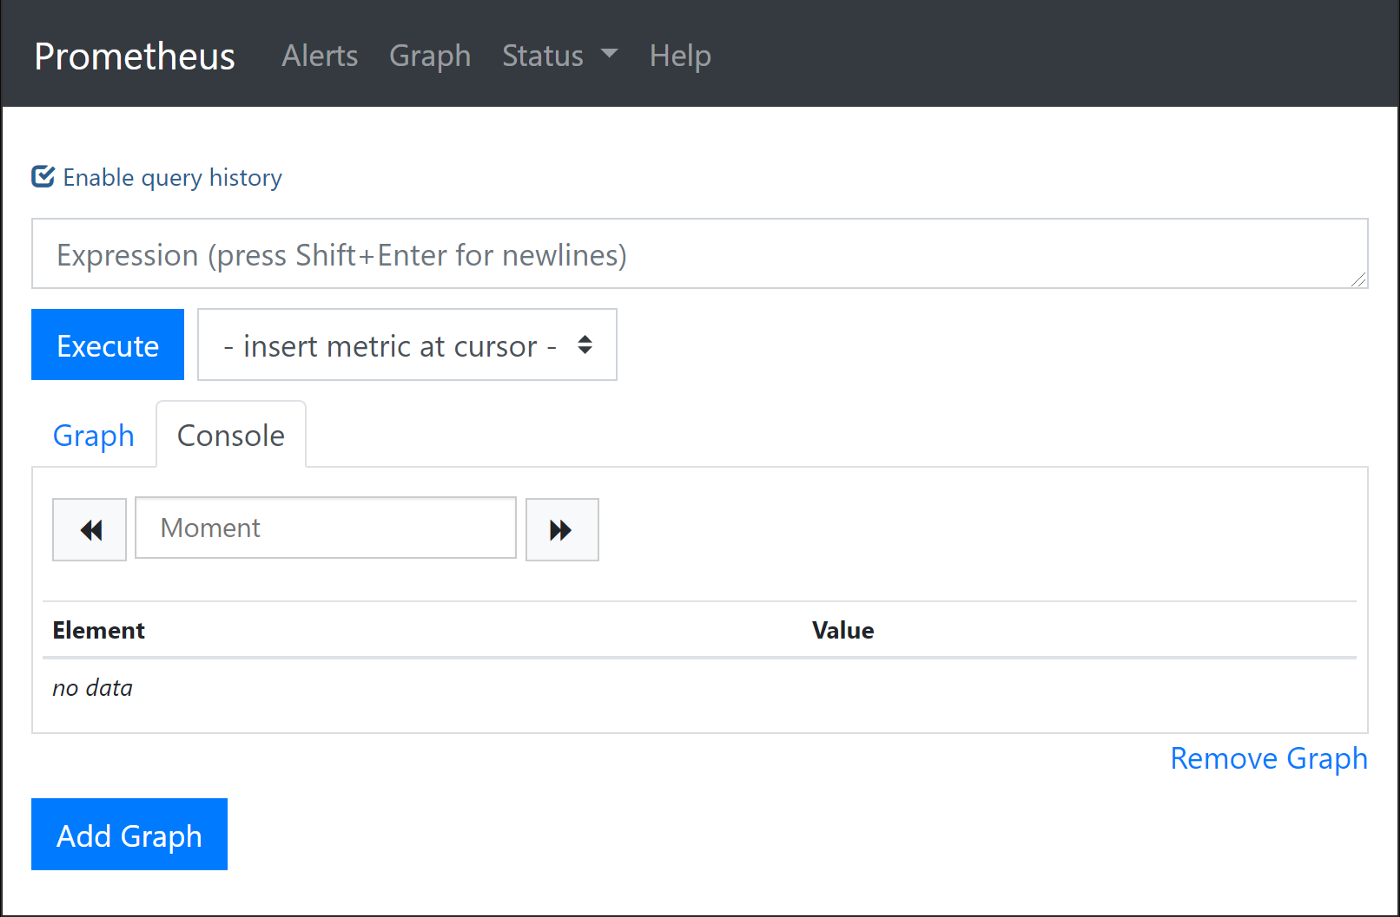
If you access the URL in the Prometheus web interface, you should see the Traefik endpoint :
![]()
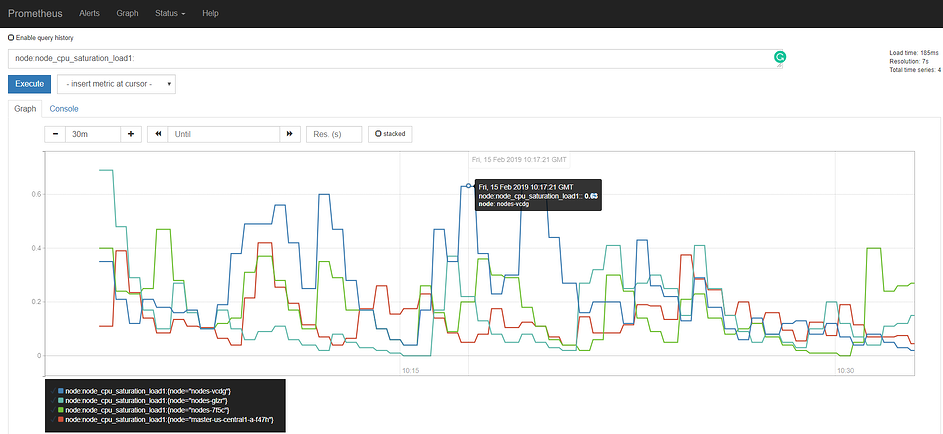
Using the main web interface, we can locate some traefik metrics (very few of them, because we don’t have any Traefik frontends or backends configured for this example) and retrieve its values:
![]()
We already have a Prometheus on Kubernetes working example.
In addition to the use of static targets in the configuration, Prometheus implements a really interesting service discovery in Kubernetes, allowing us to add targets annotating pods or services with these metadata:
annotations:
  prometheus.io/port: 9216
  prometheus.io/scrape: true
You have to indicate Prometheus to scrape the pod or service and include information of the port exposing metrics.
Step 1 — Creating a Custom Values File
Before we install the Helm chart, we’ll create a custom values file that will override some of the chart’s defaults with DigitalOcean-specific configuration parameters. To learn more about overriding default chart values, consult the section of the Helm docs.
To begin, create and open a file called on your local machine using or your favorite editor:
Copy and paste in the following custom values, which enable persistent storage for the Prometheus, Grafana, and Alertmananger components, and disable monitoring for Kubernetes control plane components not exposed on DigitalOcean Kubernetes:
custom-values.yaml
In this file, we override some of the default values packaged with the chart in its values.yaml file.
We first enable persistent storage for Prometheus, Grafana, and Alertmanager so that their data persists across Pod restarts. Behind the scenes, this defines a Persistent Volume Claim (PVC) for each component, using the DigitalOcean Block Storage storage class. You should modify the size of these PVCs to suit your monitoring storage needs. To learn more about PVCs, consult Persistent Volumes from the official Kubernetes docs.
Next, replace with a secure password that you’ll use to log in to the Grafana metrics dashboard with the admin user.
We’ll then configure a different port for node-exporter. Node-exporter runs on each Kubernetes node and provides OS and hardware metrics to Prometheus. We must change its default port to get around the DigitalOcean Kubernetes firewall defaults, which will block port 9100 but allow ports in the range 30000-32767. Alternatively, you can configure a custom firewall rule for node-exporter. To learn how, consult How to Configure Firewall Rules from the official DigitalOcean Cloud Firewalls docs.
Finally, we’ll disable metrics collection for three Kubernetes that do not expose metrics on DigitalOcean Kubernetes: the Kubernetes Scheduler and Controller Manager, and etcd cluster data store.
To see the full list of configurable parameters for the chart, consult the section from the chart repo README or the default values file.
When you’re done editing, save and close the file. We can now install the chart using Helm.
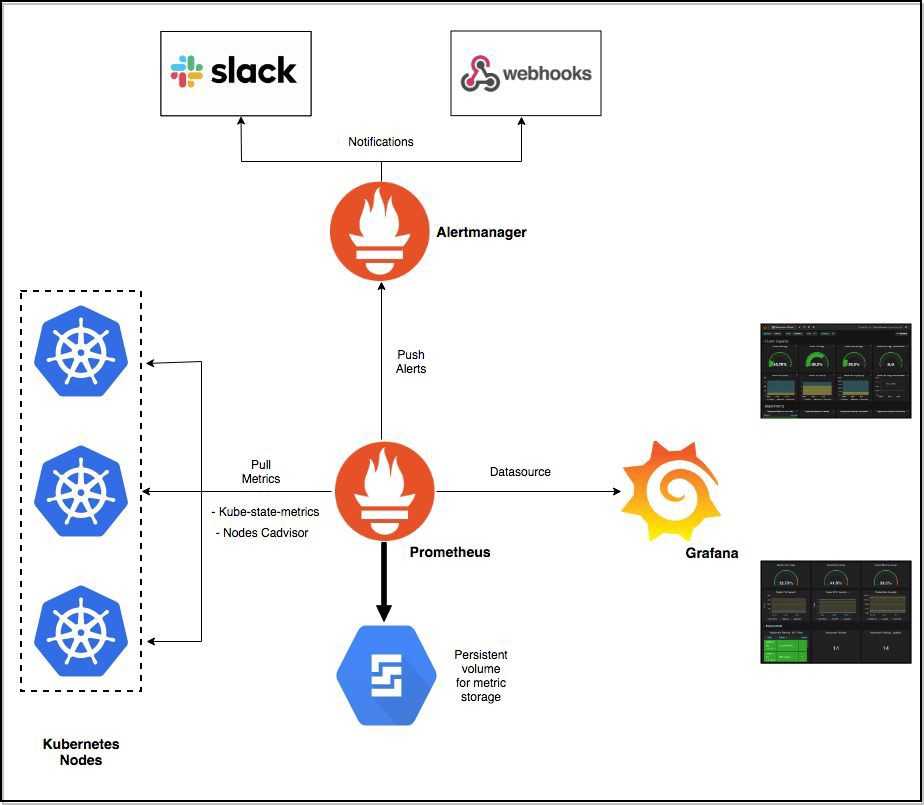
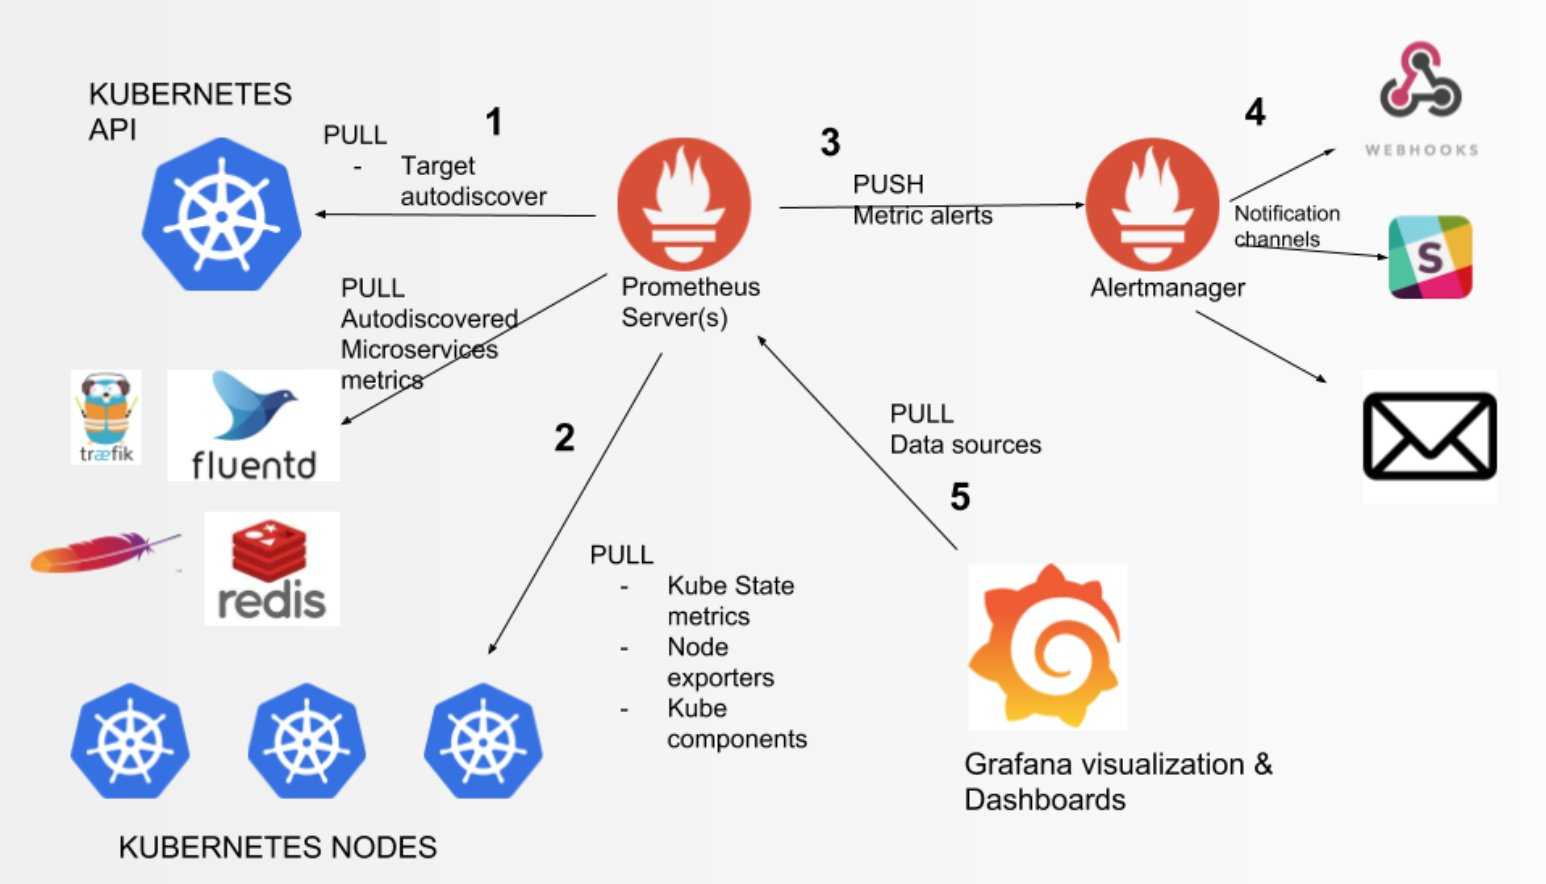
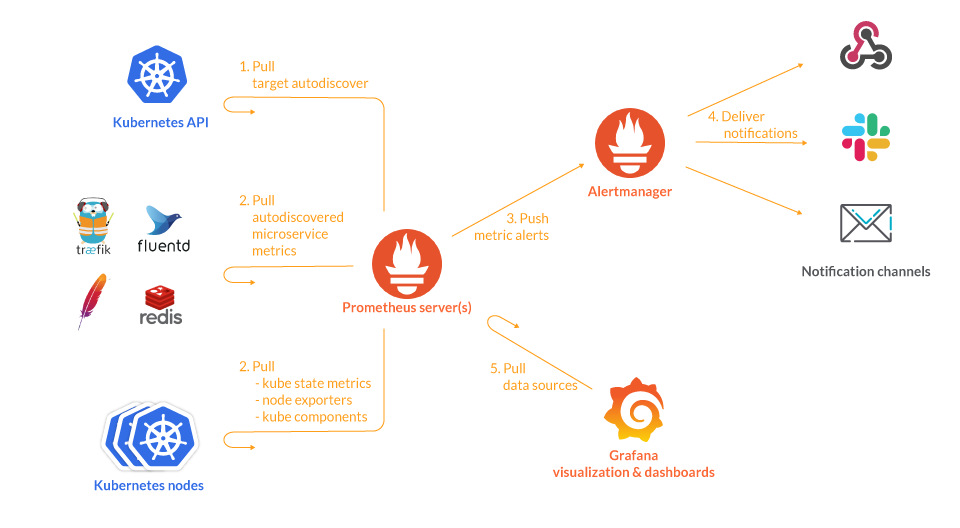
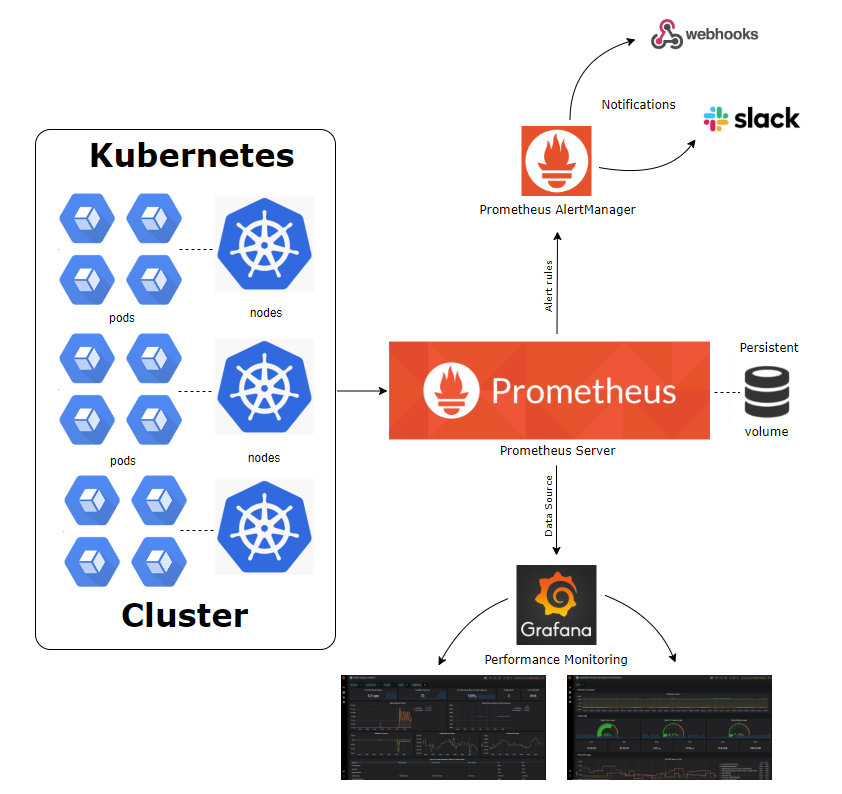
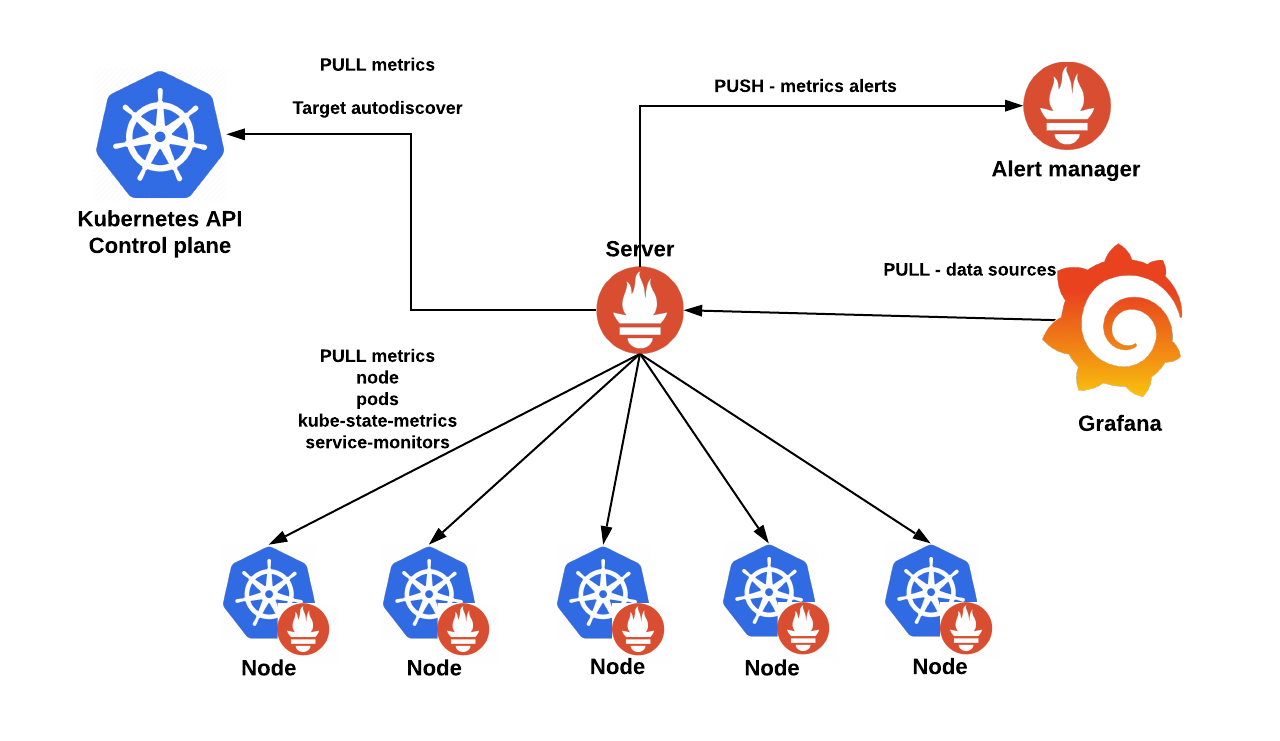
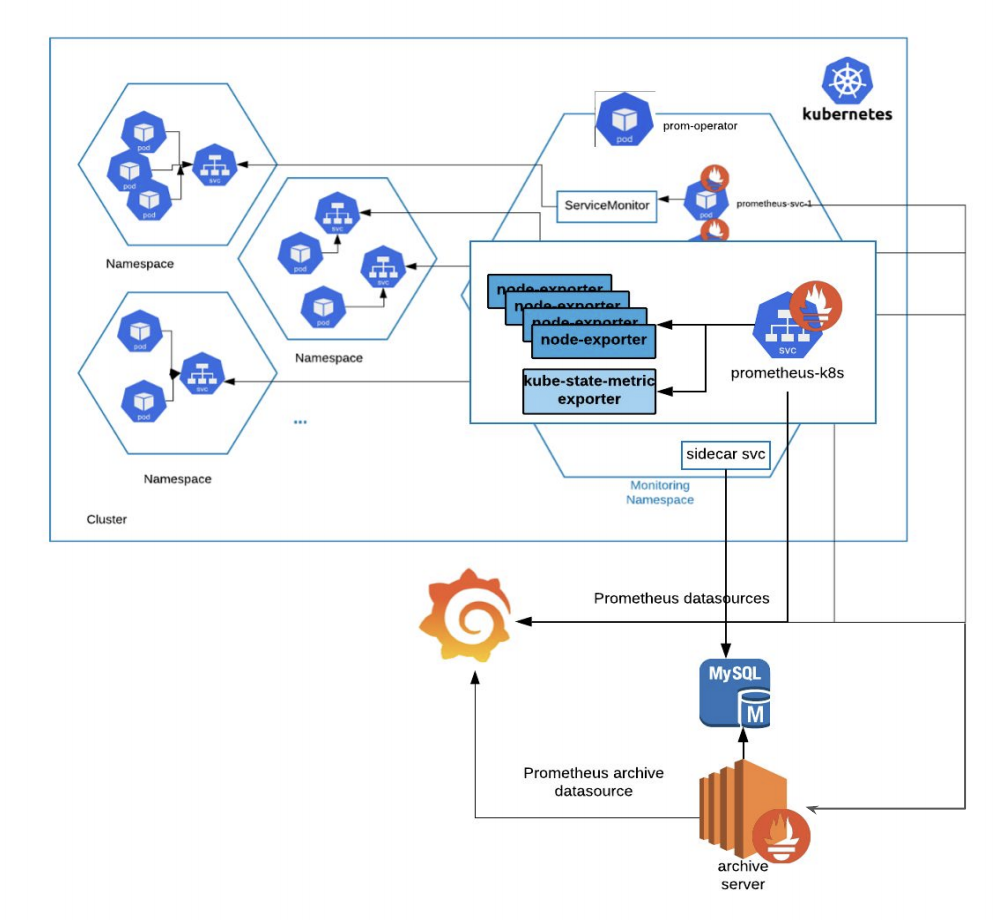
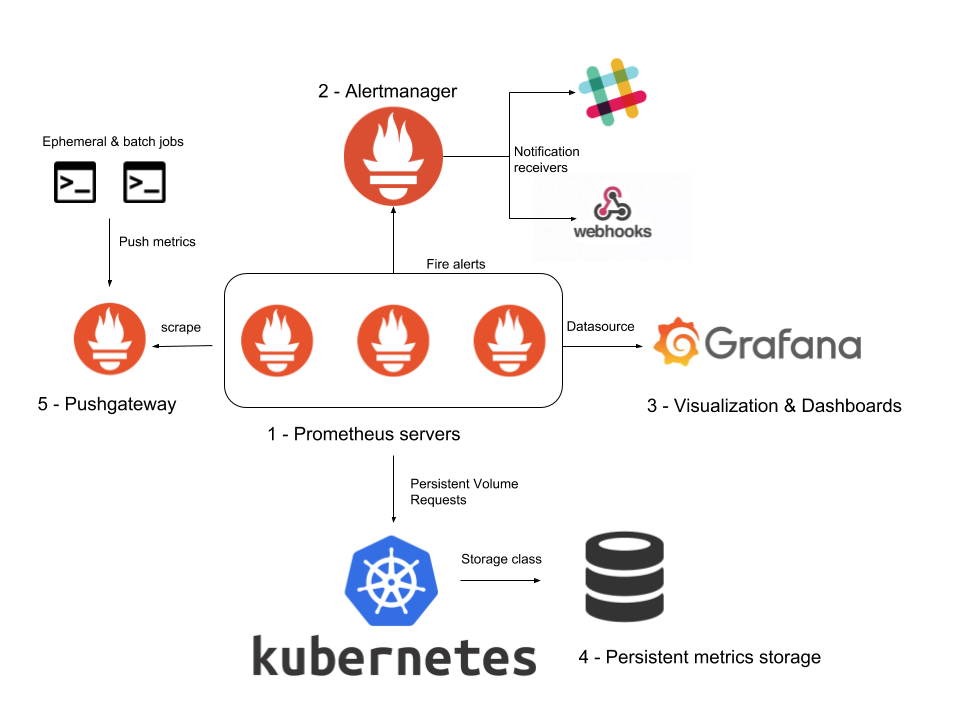
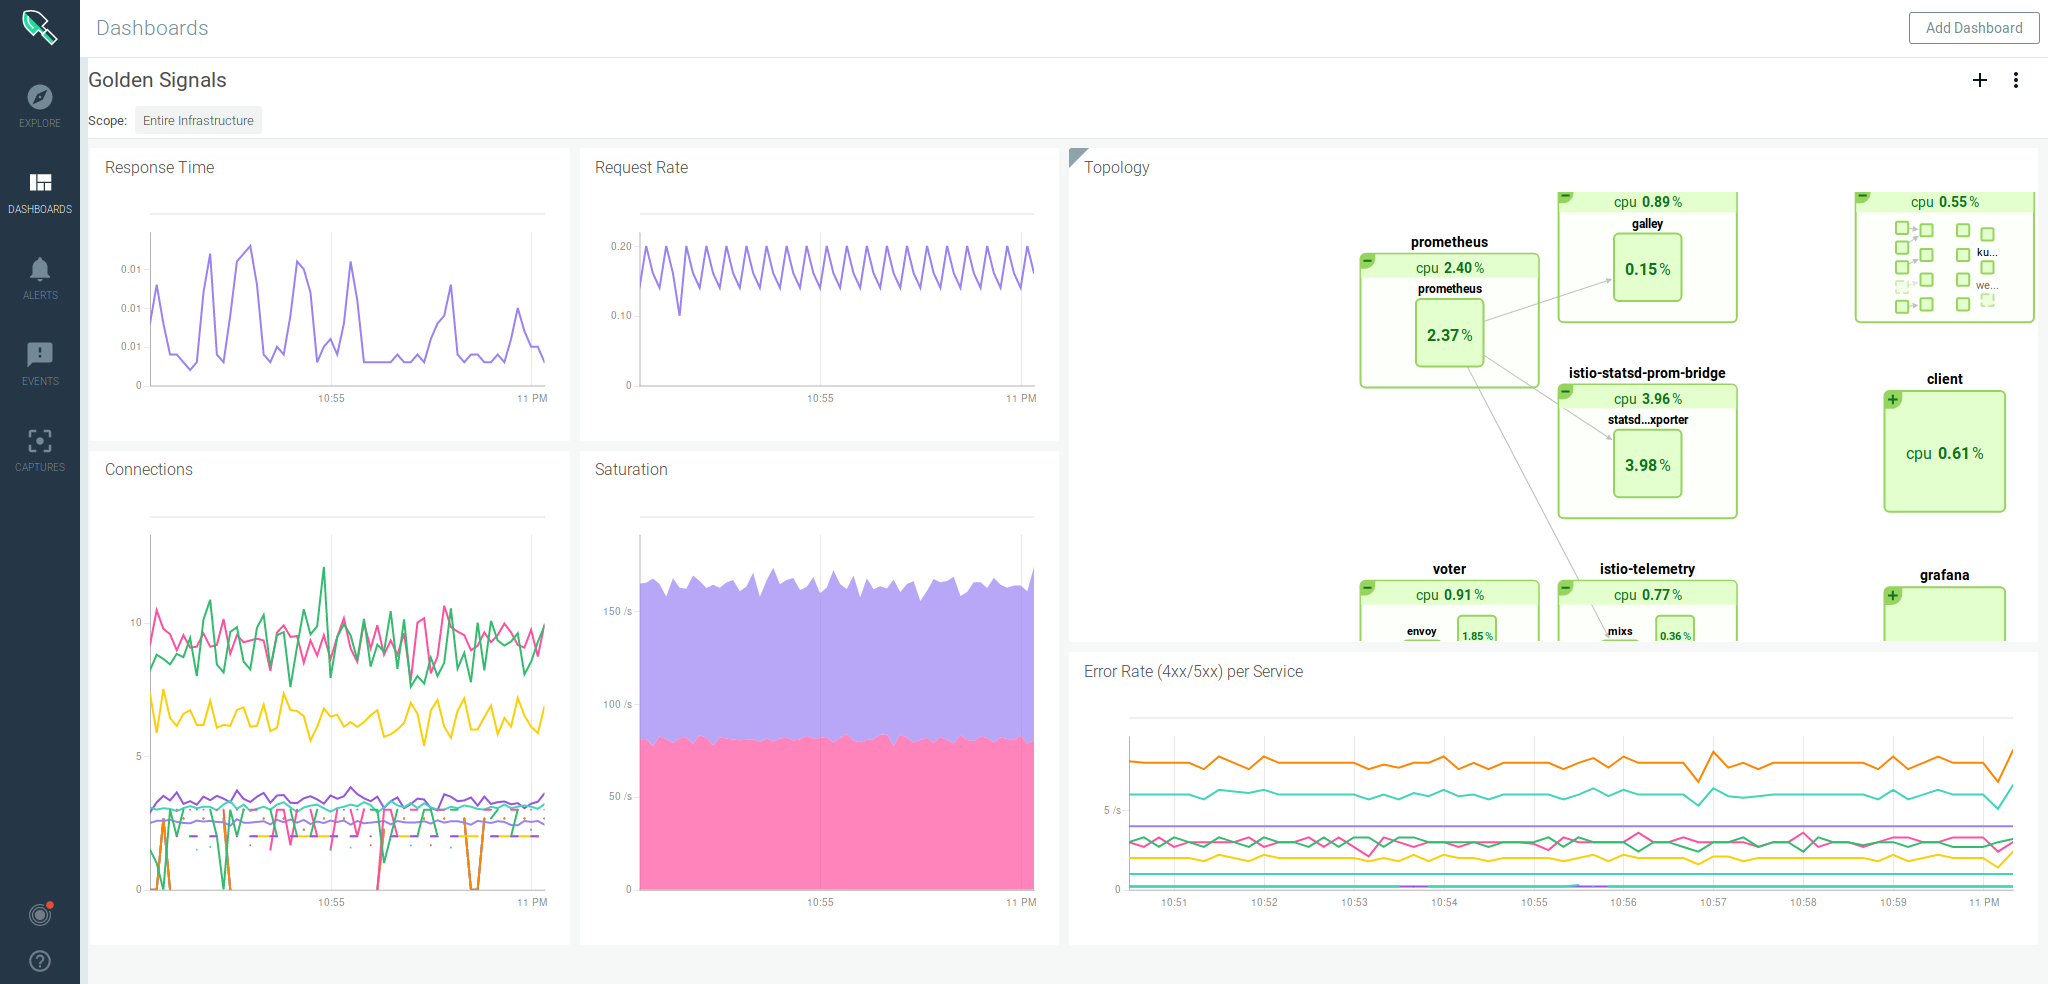
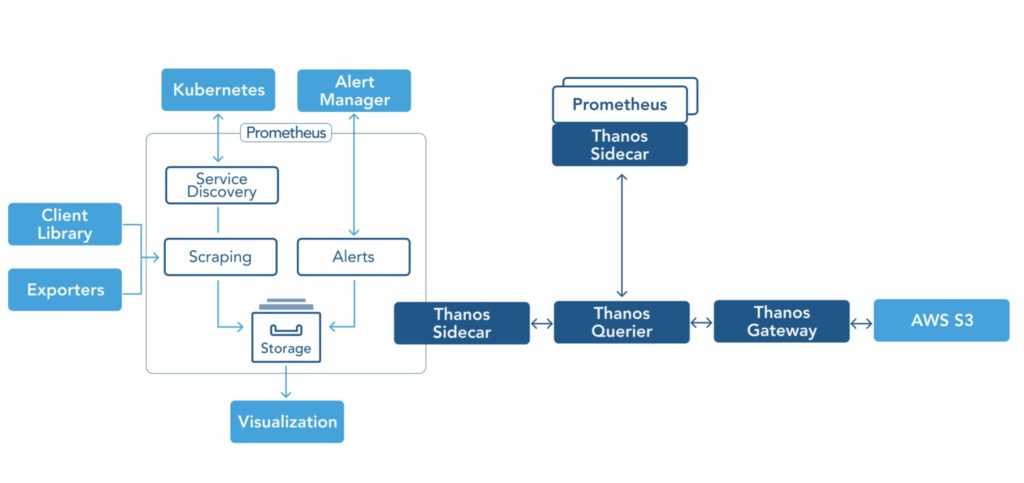
Kubernetes monitoring with Prometheus: Architecture overview
We will get into more detail later on. This diagram covers the basic entities we want to deploy in our Kubernetes cluster:
![]()
- The Prometheus servers need as much target auto discovery as possible. There are several options to achieve this:
-
Prometheus Kubernetes SD (service discovery)
-
The Prometheus operator and its Custom Resource Definitions
-
Consul SD
-
Azure SD for Azure VM
-
GCE SD for GCP instances
-
EC2 SD for AWS VM
- File SD
-
- Apart from application metrics, we want Prometheus to collect metrics related to the Kubernetes services, nodes, and orchestration status.
-
Node exporter for the classical host-related metrics: cpu, mem, network, etc.
-
for orchestration and cluster level metrics: deployments, pod metrics, resource reservation, etc.
- Kubernetes control plane metrics: kubelet, etcd, dns, scheduler, etc.
-
- Prometheus can configure rules to trigger alerts using PromQL. will be in charge of managing alert notification, grouping, inhibition, etc.
- The AlertManager component configures the receivers and gateways to deliver alert notifications.
- Grafana can pull metrics from any number of Prometheus servers and display panels and Dashboards.
Системные требования
Как таковых жестких системных требований у Kubernetes нет. Он с очень маленьких установок расширяется до огромных кластеров. Для того, чтобы его просто попробовать и посмотреть, достаточно следующих виртуальных машин:
- 2-3 мастер ноды с 2 cpu и 4 gb ram
- ingress нода с 1 cpu и 2 gb ram
- рабочие ноды для контейнеров от 2 cpu и 4 gb ram
Для того, чтобы просто запустить кластер, достаточно буквально двух виртуальных машин, которые одновременно будут и мастер и рабочими нодами. Но я рекомендую сразу планировать более ли менее полную структуру, которую можно брать за основу для последующего превращения в рабочий кластер. Я буду разворачивать кластер на следующих виртуальных машинах.
| Название | IP | CPU | RAM | HDD |
| kub-master-1 | 10.1.4.36 | 2 | 4G | 50G |
| kub-master-2 | 10.1.4.37 | 2 | 4G | 50G |
| kub-master-3 | 10.1.4.38 | 2 | 4G | 50G |
| kub-ingress-1 | 10.1.4.39 | 2 | 4G | 50G |
| kub-node-1 | 10.1.4.32 | 2 | 4G | 50G |
| kub-node-2 | 10.1.4.33 | 2 | 4G | 50G |
В моем случае это виртуальные машины на двух гипервизорах Hyper-V. Как я уже сказал в системных требованиях, для теста ресурсов можно и чуть меньше дать, но у меня есть запас, поэтому я такие ресурсы выделил для кластера Kubernetes. Перед установкой кластера рекомендую сделать снепшоты чистых систем, чтобы можно было оперативно вернуться к исходному состоянию, если что-то пойдет не так. Вручную готовить и переустанавливать виртуалки хлопотно.
По гипервизорам виртуальные машины распределил следующим образом.
Упомяну про еще одну рекомендацию. Мастер ноды с etcd дают приличную нагрузку на диск. Их рекомендуется размещать на быстрых ssd дисках. Чем больше кластер — тем больше нагрузка. В наших тестах сойдет и hdd диск под мастер. Но если будете использовать в продакшене с учетом расширения и роста, лучше сразу планируйте быстрые диски под мастера.
Step 3 — Accessing Grafana and Exploring Metrics Data
The Grafana Service manifest exposes Grafana as a Service, which means that it’s only accessible via a cluster-internal IP address. To access Grafana outside of your Kubernetes cluster, you can either use to update the Service in-place to a public-facing type like or , or to forward a local port to a Grafana Pod port. In this tutorial we’ll forward ports, so you can skip ahead to . The following section on exposing Grafana externally is included for reference purposes.
Exposing the Grafana Service using a Load Balancer (optional)
If you’d like to create a DigitalOcean Load Balancer for Grafana with an external public IP, use to update the existing Grafana Service in-place to the Service type:
The kubectl command allows you to update Kubernetes objects in-place to make changes without having to re-deploy the objects. You can also modify the master manifest file directly, adding a parameter to the . To learn more about and Kubernetes Service types, you can consult the Update API Objects in Place Using kubectl patch and Services resources in the official Kubernetes docs.
After running the above command, you should see the following:
It may take several minutes to create the Load Balancer and assign it a public IP. You can track its progress using the following command with the flag to watch for changes:
Once the DigitalOcean Load Balancer has been created and assigned an external IP address, you can fetch its external IP using the following commands:
You can now access the Grafana UI by navigating to .
Forwarding a Local Port to Access the Grafana Service
If you don’t want to expose the Grafana Service externally, you can also forward local port into the cluster directly to a Grafana Pod using .
You should see the following output:
This will forward local port to of the Grafana Pod . To learn more about forwarding ports into a Kubernetes cluster, consult Use Port Forwarding to Access Applications in a Cluster.
Visit in your web browser. You should see the following Grafana login page:
![]()
To log in, use the default username (if you haven’t modified the parameter), and the password you configured in Step 1.
You’ll be brought to the following Home Dashboard:
In the left-hand navigation bar, select the Dashboards button, then click on Manage:
![]()
You’ll be brought to the following dashboard management interface, which lists the dashboards configured in the manifest:
These dashboards are generated by , an open-source project that allows you to create a standardized set of cluster monitoring Grafana dashboards and Prometheus alerts. To learn more, consult the kubernetes-mixin GitHub repo.
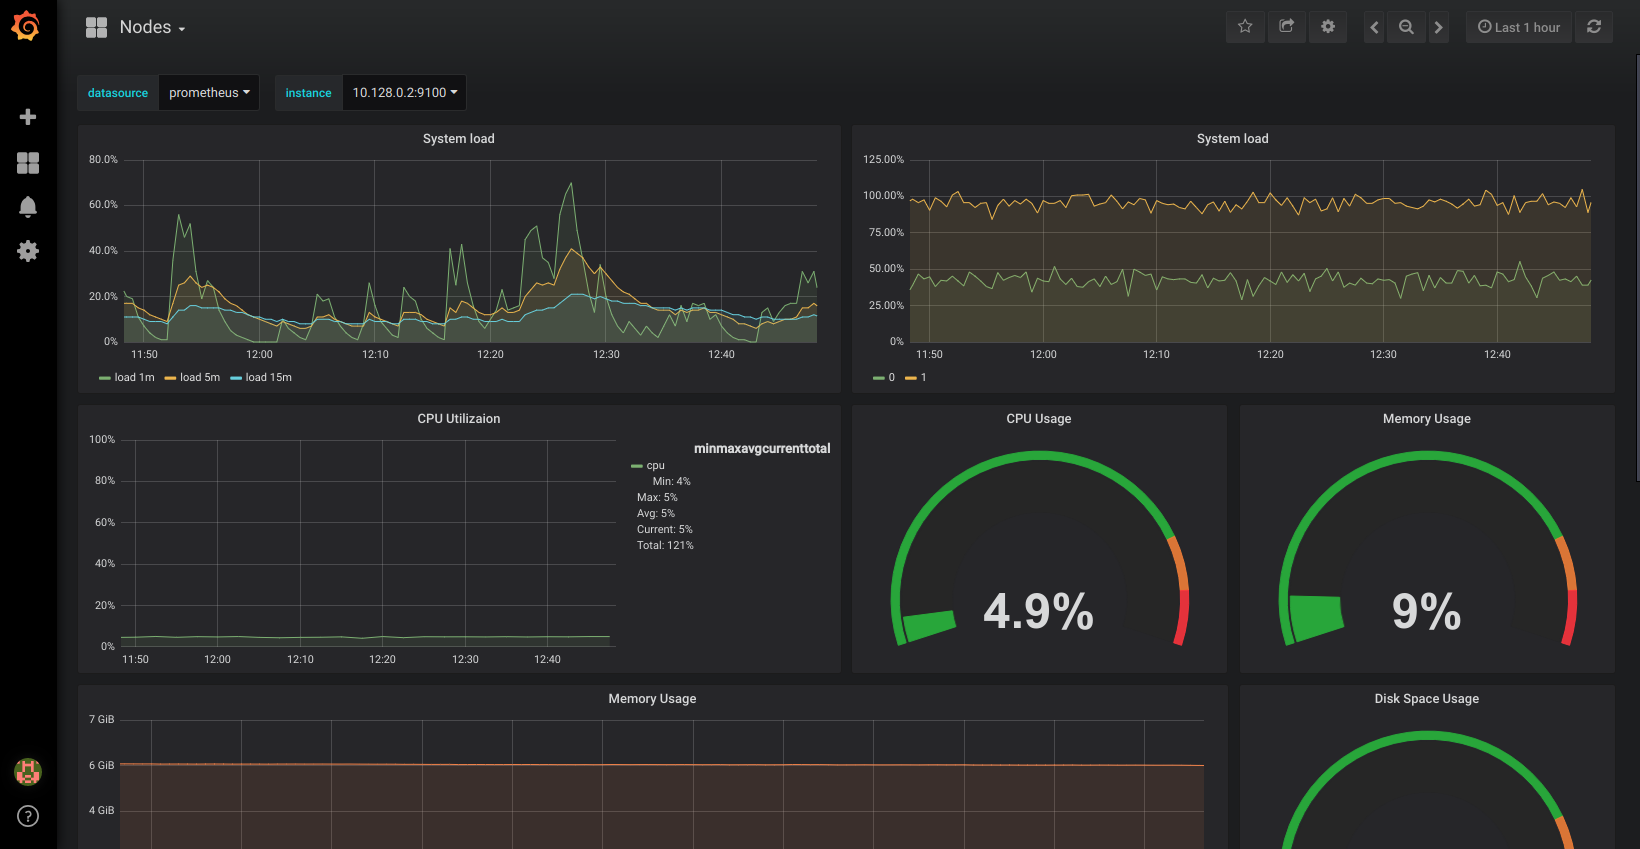
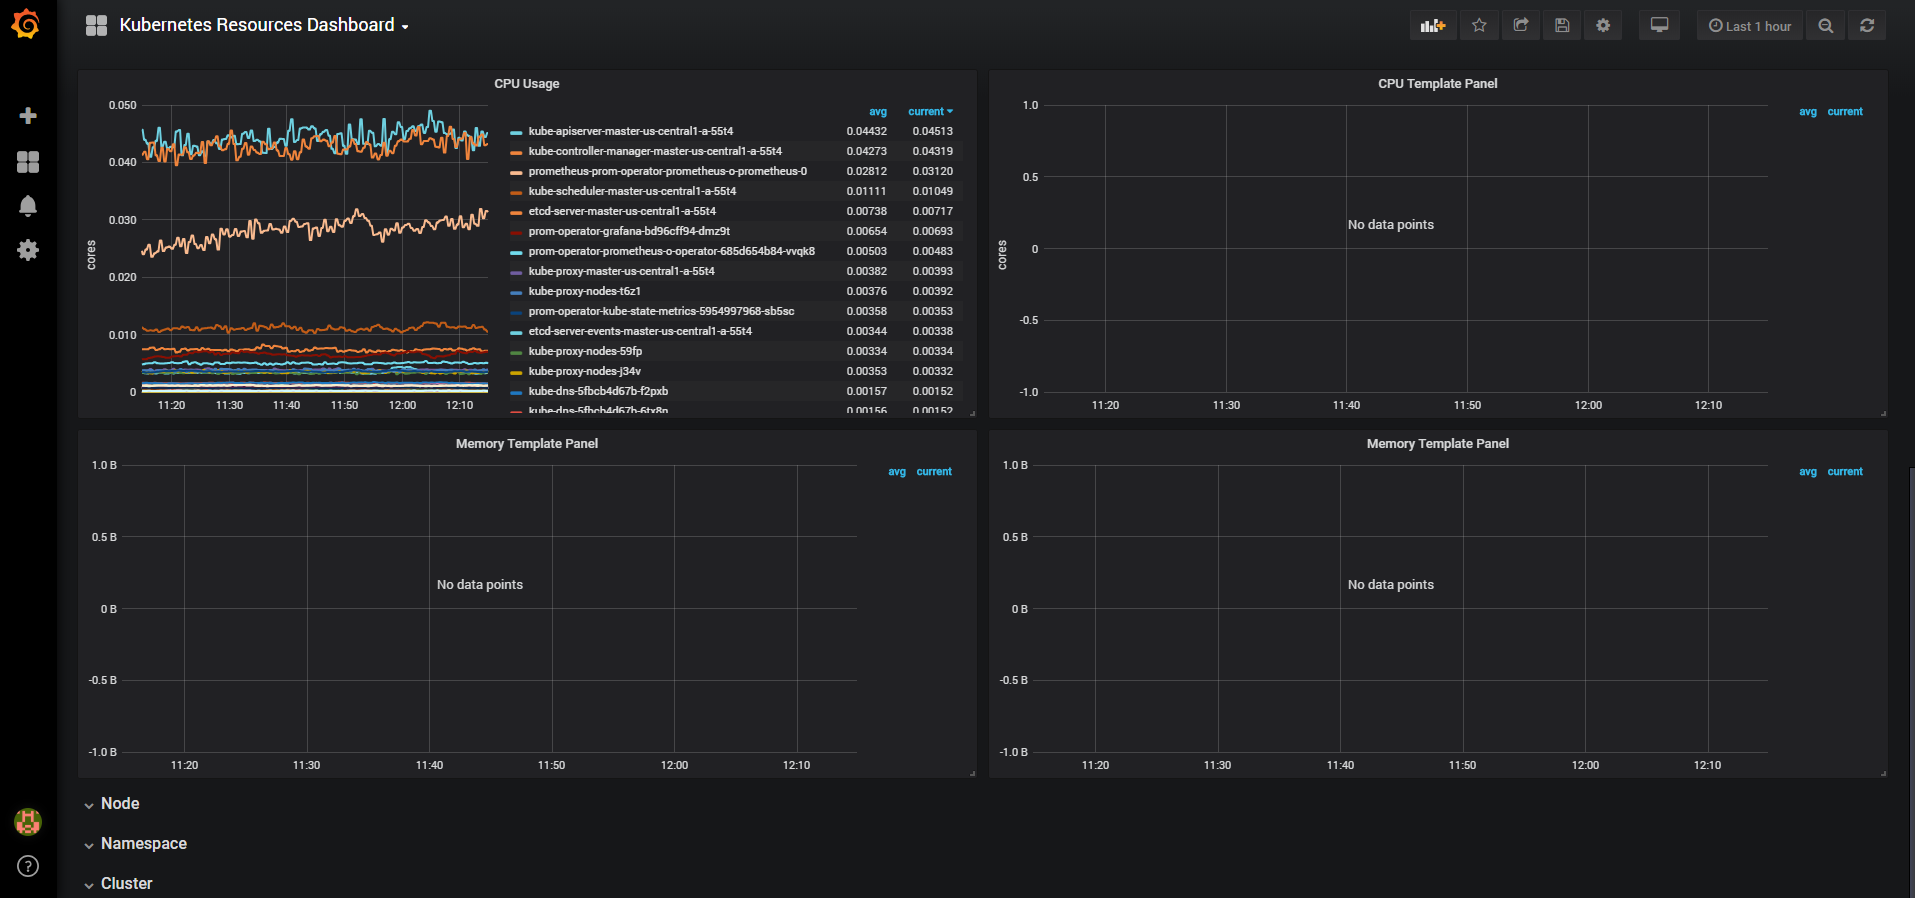
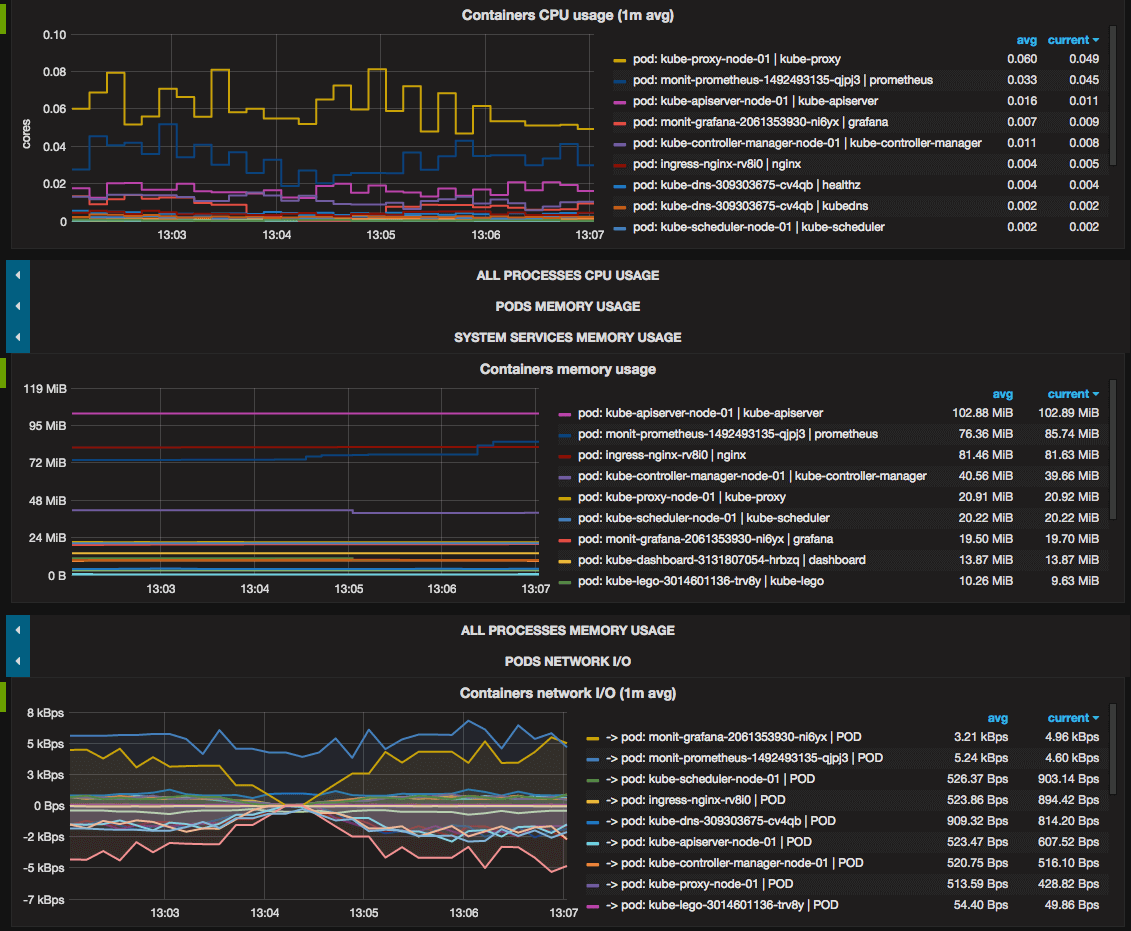
Click in to the Kubernetes / Nodes dashboard, which visualizes CPU, memory, disk, and network usage for a given node:
Describing how to use these dashboards is outside of this tutorial’s scope, but you can consult the following resources to learn more:
- To learn more about the USE method for analyzing a system’s performance, you can consult Brendan Gregg’s The Utilization Saturation and Errors (USE) Method page.
- Google’s SRE Book is another helpful resource, in particular Chapter 6: Monitoring Distributed Systems.
- To learn how to build your own Grafana dashboards, check out Grafana’s Getting Started page.
In the next step, we’ll follow a similar process to connect to and explore the Prometheus monitoring system.
Установка и настройка Docker
На все узлы кластера выполняем установку Docker следующей командой:
apt-get install docker docker.io
После установки разрешаем автозапуск сервиса docker:
systemctl enable docker
Создаем файл:
vi /etc/docker/daemon.json
{
«exec-opts»: ,
«log-driver»: «json-file»,
«log-opts»: {
«max-size»: «100m»
},
«storage-driver»: «overlay2»,
«storage-opts»:
}
* для нас является важной настройкой cgroupdriver — она должна быть выставлена в значение systemd. В противном случае, при создании кластера Kubernetes выдаст предупреждение
Хоть на возможность работы последнего это не влияет, но мы постараемся выполнить развертывание без ошибок и предупреждений со стороны системы.
И перезапускаем docker:
systemctl restart docker
Create a Config Map To Externalize Prometheus Configurations
All configurations for Prometheus are part of file and all the alert rules for Alertmanager are configured in .
- : This is the main Prometheus configuration which holds all the scrape configs, service discovery details, storage locations, data retention configs, etc)
- : This file contains all the Prometheus alerting rules
By externalizing Prometheus configs to a Kubernetes config map, you don’t have to build the Prometheus image whenever you need to add or remove a configuration. You need to update the config map and restart the Prometheus pods to apply the new configuration.
The config map with all the Prometheus scrape config and alerting rules gets mounted to the Prometheus container in location as and files.
Step 1: Create a file called and copy the file contents from this link –> Prometheus Config File.
Step 2: Execute the following command to create the config map in Kubernetes.
It creates two files inside the container.
The contains all the configurations to discover pods and services running in the Kubernetes cluster dynamically. We have the following scrape jobs in our Prometheus scrape configuration.
- : It gets all the metrics from the API servers.
- : It collects all the kubernetes node metrics.
- : All the pod metrics get discovered if the pod metadata is annotated with and annotations.
- : Collects all cAdvisor metrics.
- : All the Service endpoints are scrapped if the service metadata is annotated with prometheus.io/scrape and prometheus.io/port annotations. It can be used for black-box monitoring.
contains all the alert rules for sending alerts to the Alertmanager.
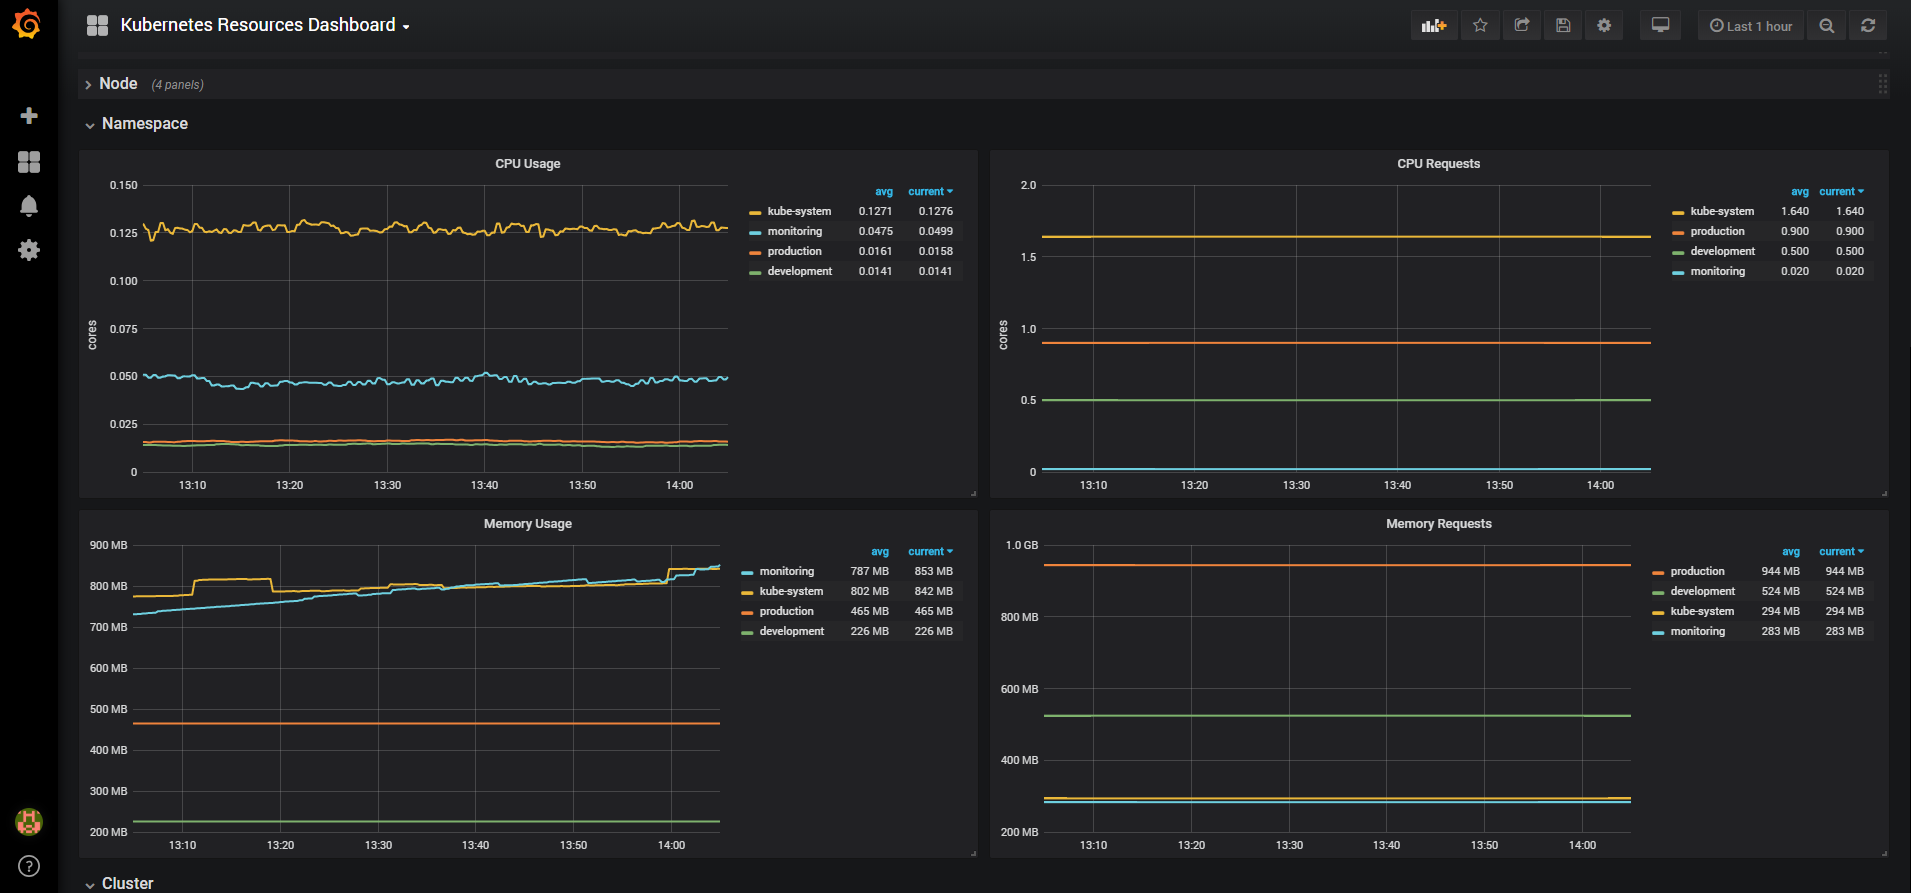
Resources — настройка ресурсов
Расскажу, как ограничиваются выделяемые для подов вычислительные ресурсы. Речь идет про CPU и Оперативную память. Задать верхнюю планку использования ресурсов можно с помощью Limits. А с помощью Requests мы можем зарезервировать необходимые ресурсы для пода на ноде. Если в Requests у пода параметры выше, чем есть свободных ресурсов у ноды, то под не сможет приехать на эту ноду.
Важно понимать, что реквесты никак не следят за реальным использованием ресурсов. То есть это просто пожелание к ресурсам ноды, где будет размещаться под
При этом после размещения он сможет занять ресурсов больше, чем указано в Requests. Кластер kubernetes за этим не следит. Если реквесты вообще не указать, то под может приехать на ноду, где свободно очень мало ресурсов, а ему для работы надо больше. В итоге он будет падать. Таким образом, requests используются для планирования ресурсов кластера.
Далее пример деплоймента с указанными параметрами ресурсов. Дополняем предыдущие примеры.
---
apiVersion: apps/v1
kind: Deployment
metadata:
  name: deployment-nginx
spec:
  replicas: 2
  selector:
    matchLabels:
      app: my-nginx
  strategy:
    rollingUpdate:
      maxSurge: 1
      maxUnavailable: 1
    type: RollingUpdate
  template:
    metadata:
      labels:
        app: my-nginx
    spec:
      containers:
      - image: nginx:1.16
        name: nginx
        ports:
        - containerPort: 80
        readinessProbe:
          failureThreshold: 5
          httpGet:
            path: /
            port: 80
          periodSeconds: 10
          successThreshold: 2
          timeoutSeconds: 3
        livenessProbe:
          failureThreshold: 3
          httpGet:
            path: /
            port: 80
          periodSeconds: 10
          successThreshold: 1
          timeoutSeconds: 3
          initialDelaySeconds: 10
        resources:
          requests:
            cpu: 100m
            memory: 256Mi
          limits:
            cpu: 300m
            memory: 512Mi
Память выделяется в мегабайтах, а вот CPU в милли cpu, что равно 1/1000 от процессоронго ядра. То есть 1000 миллицпу это одно ядро процессора ноды. Запустим наш deployment и посмотрим на один из подов.
# kubectl describe pod deployment-nginx-79cd6dc79c-rlhtg
Вот они, наши проверки и лимиты с реквестами.
Troubleshooting
See the general guidelines for getting support from the community.
Error retrieving kubelet metrics
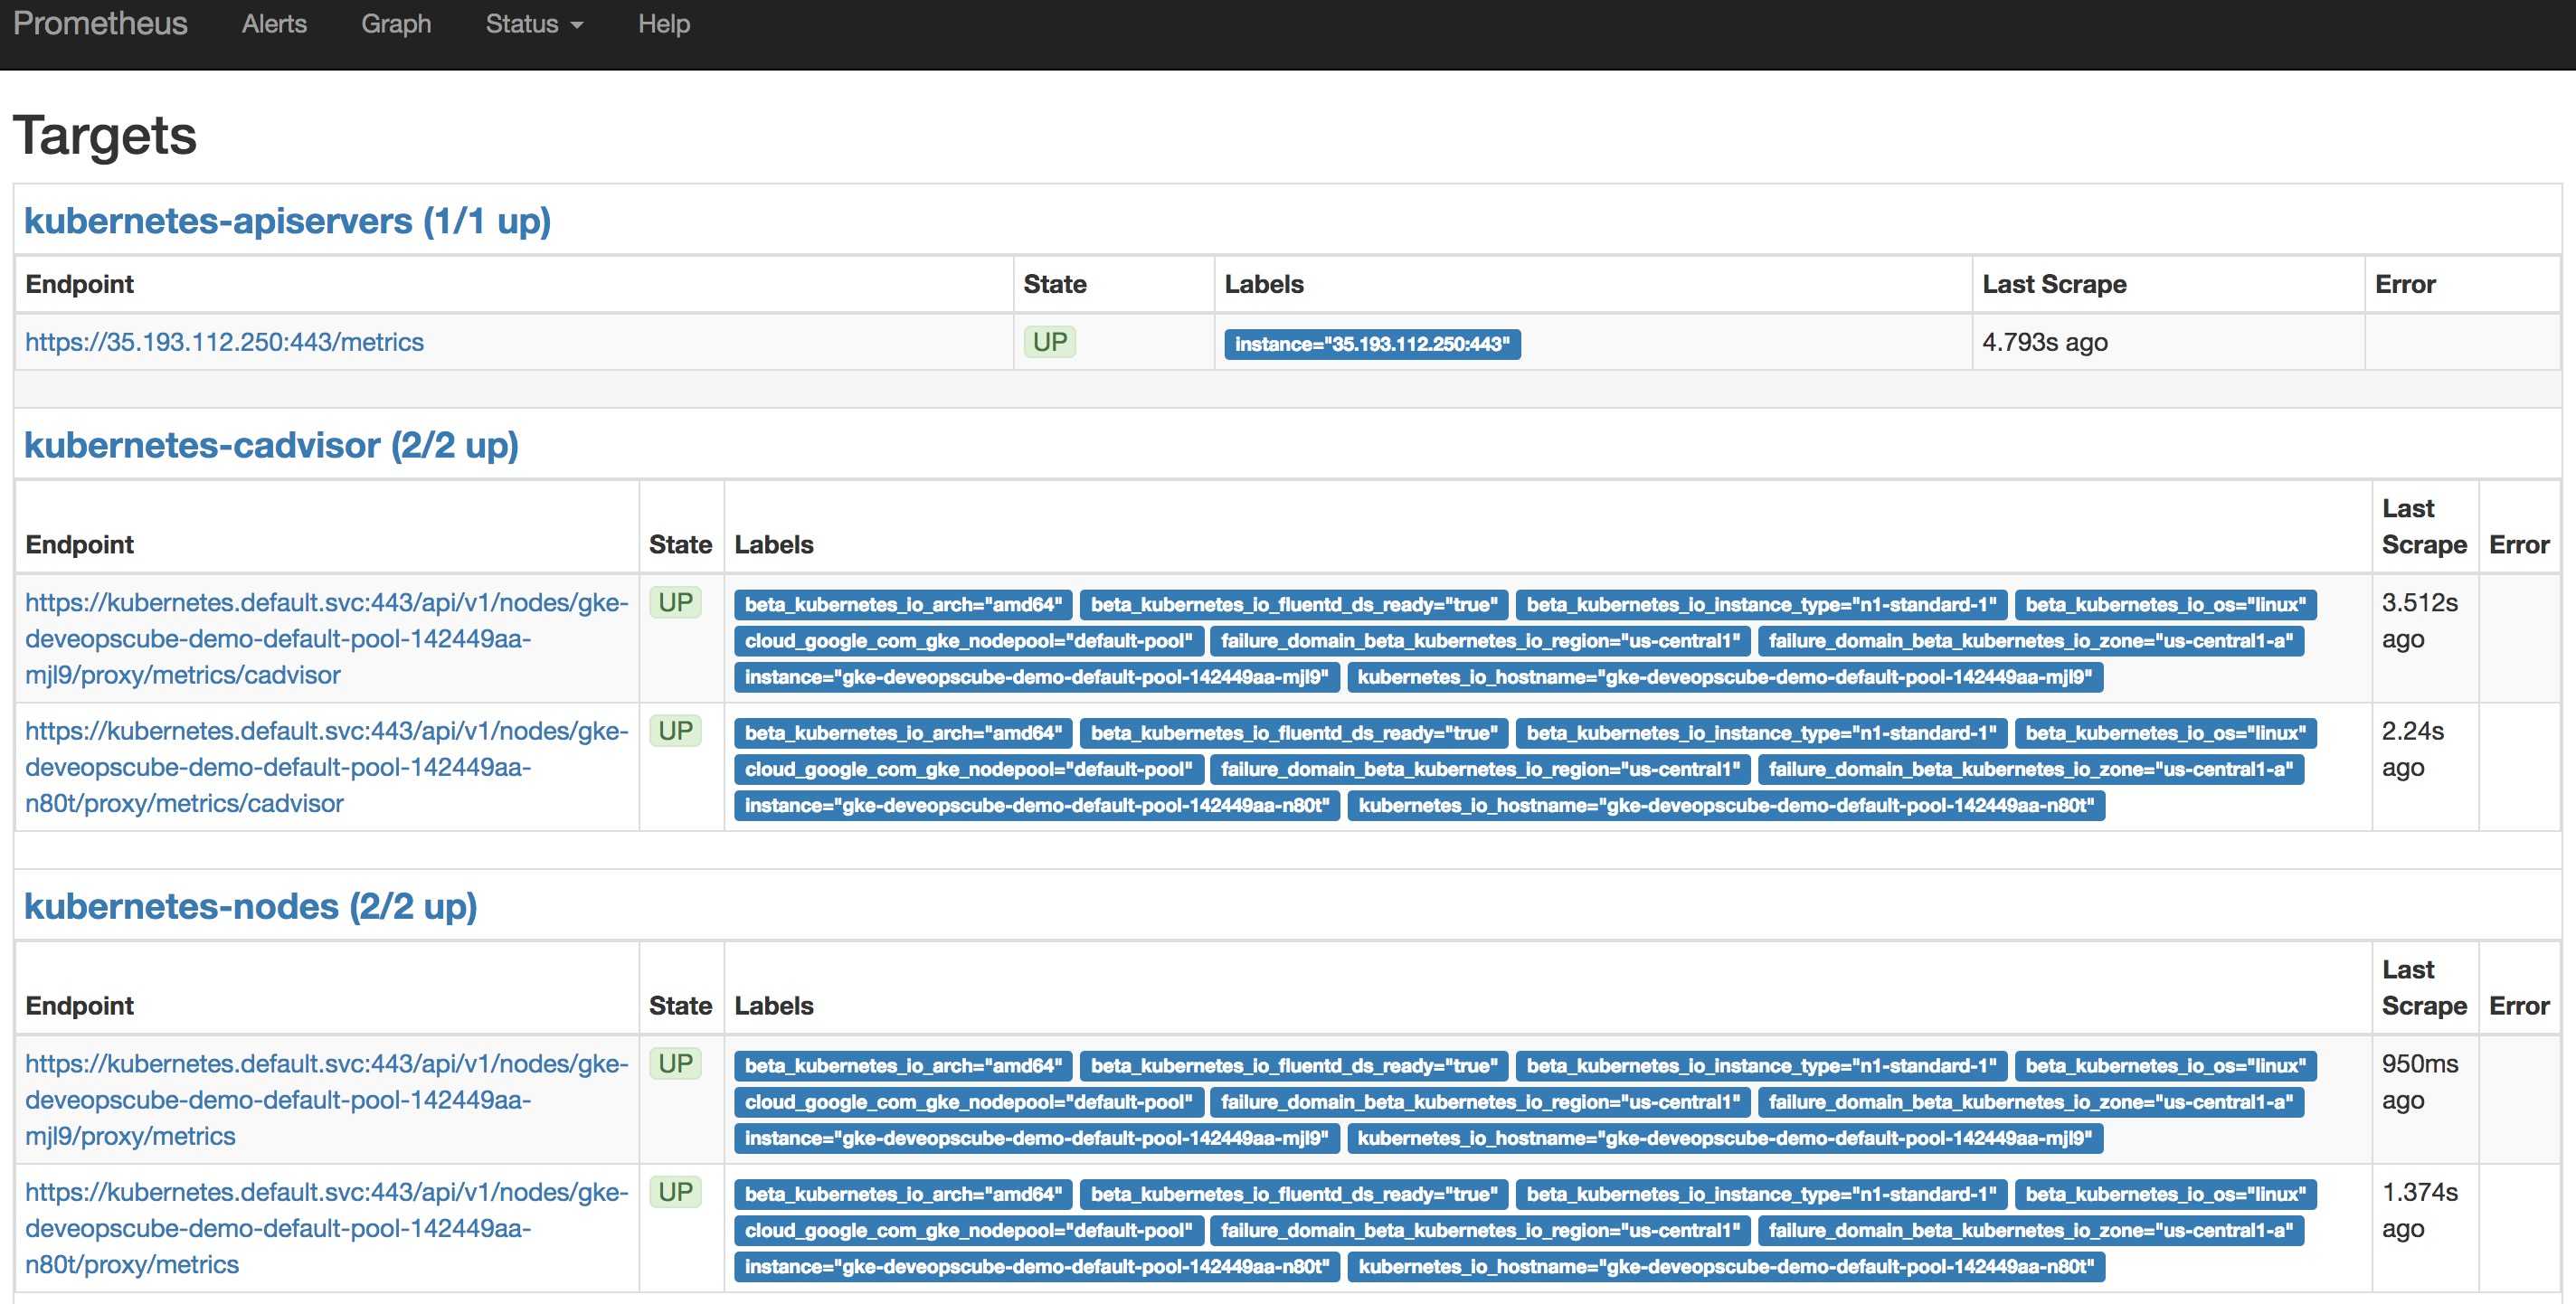
Should the Prometheus page show kubelet targets, but not able to successfully scrape the metrics, then most likely it is a problem with the authentication and authorization setup of the kubelets.
As described in the section, in order to retrieve metrics from the kubelet token authentication and authorization must be enabled. Some Kubernetes setup tools do not enable this by default.
- If you are using Google’s GKE product, see cAdvisor support.
- If you are using AWS EKS, see AWS EKS CNI support.
- If you are using Weave Net, see Weave Net support.
Authentication problem
The Prometheus page will show the kubelet job with the error , when token authentication is not enabled. Ensure, that the flag is enabled on all kubelet configurations.
Authorization problem
The Prometheus page will show the kubelet job with the error , when token authorization is not enabled. Ensure that the flag is enabled on all kubelet configurations.
kube-state-metrics resource usage
In some environments, kube-state-metrics may need additional
resources. One driver for more resource needs, is a high number of
namespaces. There may be others.
kube-state-metrics resource allocation is managed by
addon-resizer
You can control it’s parameters by setting variables in the
config. They default to:
    kubeStateMetrics+:: {
      baseCPU: '100m',
      cpuPerNode: '2m',
      baseMemory: '150Mi',
      memoryPerNode: '30Mi',
    }
Error retrieving kube-proxy metrics
By default, kubeadm will configure kube-proxy to listen on 127.0.0.1 for metrics. Because of this prometheus would not be able to scrape these metrics. This would have to be changed to 0.0.0.0 in one of the following two places:
- Before cluster initialization, the config file passed to kubeadm init should have KubeProxyConfiguration manifest with the field metricsBindAddress set to 0.0.0.0:10249
-
If the k8s cluster is already up and running, we’ll have to modify the configmap kube-proxy in the namespace kube-system and set the metricsBindAddress field. After this kube-proxy daemonset would have to be restarted with
Дополнительные ссылки
- Цели: цели проекта Minikube смотрите в дорожной карте.
- Руководство по разработке: посмотрите CONTRIBUTING.md, чтобы ознакомиться с тем, как отправлять пулрексты.
- Сборка Minikube: инструкции по сборке/тестированию Minikube из исходного кода смотрите в руководстве по сборке.
- Добавление новой зависимости: инструкции по добавлению новой зависимости в Minikube смотрите в руководстве по добавлению зависимостей.
- Добавление нового дополнения: инструкции по добавлению нового дополнения для Minikube смотрите в руководстве по добавлению дополнений.
- MicroK8: пользователи Linux, которые не хотят использовать виртуальную машину, могут в качестве альтернативы посмотреть в сторону MicroK8s.
Типичный кластер Kubernetes
На диаграмме ниже показано типичное развертывание с использованием Kubernetes.
Типичный кластер Kubernetes
Развертывание состоит из трех уровней:
-
Виртуальные машины: master-ноды и worker-ноды.
-
Инфраструктурные компоненты Kubernetes.
-
Пользовательские приложения.
Внутри кластера компоненты взаимодействуют друг с другом обычно через HTTP(s) (REST или gRPC), но некоторые из них предоставляют доступ к API снаружи (Ingress). Эти API в основном используются для следующего:
-
Управление кластером через Kubernetes API Server.
-
Взаимодействие с пользовательскими приложениями через Ingress Controller.
В некоторых сценариях приложения могут отправлять трафик за пределы кластера для использования сторонних сервисов, таких как Azure SQL, Azure Blob или любых других.