Настройка назначения выхода журнала ошибок
MariaDB всегда записывает свой журнал ошибок,но место назначения настраивается.
Запись журнала ошибок в файл.
Чтобы настроить запись журнала ошибок в файл, вы можете установить системную переменную . Вы можете настроить конкретное имя файла. Однако, если конкретное имя файла не настроено, журнал по умолчанию будет записан в файл в каталоге .
переменная система может быть установлена в серверной в файле опций перед запуском сервера. Например, чтобы записать журнал ошибок в файл по умолчанию , вы можете настроить следующее:
...
log_error
Если вы настроите конкретное имя файла в качестве системной переменной , и если это не абсолютный путь, то он будет относиться к каталогу . Например, если вы настроили следующее, журнал ошибок будет записан в в каталоге :
...
log_error=mariadb.err
Если это относительный путь, тогда относится к каталогу .
Однако системная переменная также может быть абсолютным путем. Например:
...
log_error=/var/log/mysql/mariadb.err
Другой способ настроить имя файла журнала ошибок, чтобы установить вариант, который конфигурирует MariaDB использовать общий префикс для всех файлов журналов (например , общий журнал запросов , журнал медленных запросов , журнал ошибок, бинарные журналы и т.д.). Имя файла журнала ошибок будет построено путем добавления к этому префиксу расширения . Например, если вы настроили следующее, то журнал ошибок по-прежнему будет записываться в в каталоге :
...
log-basename=mariadb
log_error
не может быть абсолютным путем. Имя файла журнала относится к каталогу .
Запись журнала ошибок в Stderr на Unix
В Unix, если системная переменная не установлена, то ошибки записываются в , что обычно означает, что сообщения журнала выводятся на терминал, который запустил .
Если системная переменная была установлена в файле опций или в командной строке, ее все равно можно указав —skip-log-error .
Запись журнала ошибок в Syslog на Unix
В Unix журнал ошибок также можно перенаправить в системный журнал . Как это будет сделано, зависит от того, как вы запускаете MariaDB.
Syslog с mysqld_safe
Если вы запустите MariaDB с , то журнал ошибок можно будет перенаправить в системный журнал. См. для получения дополнительной информации.
Syslog с Systemd
Если вы запускаете MariaDB с помощью , журнал ошибок также можно перенаправить в системный журнал. См. для получения дополнительной информации.
также имеет свою собственную систему ведения ,называемую журналом , и некоторые ошибки могут записываться в нее вместо этого. См. для получения дополнительной информации.
Запись журнала ошибок в консоль на Windows
В Windows, если указан параметр и если системная переменная не используется, то ошибки записываются в консоль. Если указаны оба параметра, приоритет имеет последний вариант.
Запись журнала ошибок в программу просмотра событий Windows Event Viewer
В Windows сообщения журнала об ошибках также записываются в средство просмотра событий Windows. Вы можете найти сообщения журнала ошибок MariaDB, просмотрев журналы Windows и выбрав приложение или журнал приложений , в зависимости от версии Windows.
В MariaDB 10.3 и ранее вы можете найти сообщения журнала ошибок MariaDB, выполнив поиск по Source .
В MariaDB 10.4 и более поздних версиях вы можете найти сообщения журнала ошибок MariaDB, выполнив поиск по источнику .
Checking Program Options
You can check which options a given program is going to use by using the command-line argument:
| Option | Description |
|---|---|
| Read options from option files, print all option values, and then exit the program. |
This command-line argument can be used with most of MariaDB’s command-line tools, not just . It must be given as the first argument on the command-line. For example:
$ mysqldump --print-defaults
mysqldump would have been started with the following arguments:
--ssl_cert=/etc/my.cnf.d/certificates/client-cert.pem --ssl_key=/etc/my.cnf.d/certificates/client-key.pem --ssl_ca=/etc/my.cnf.d/certificates/ca.pem --ssl-verify-server-cert --max_allowed_packet=1GB
You can also check which options a given program is going to use by using the utility and providing the names of the option groups that the program reads. For example:
$ my_print_defaults mysqldump client client-server client-mariadb
--ssl_cert=/etc/my.cnf.d/certificates/client-cert.pem
--ssl_key=/etc/my.cnf.d/certificates/client-key.pem
--ssl_ca=/etc/my.cnf.d/certificates/ca.pem
--ssl-verify-server-cert
--max_allowed_packet=1GB
The utility’s command-line option provides a shortcut to refer to all of the :
$ my_print_defaults --mysqld
--log_bin=mariadb-bin
--log_slave_updates=ON
--ssl_cert=/etc/my.cnf.d/certificates/server-cert.pem
--ssl_key=/etc/my.cnf.d/certificates/server-key.pem
--ssl_ca=/etc/my.cnf.d/certificates/ca.pem
Переменные профилирования
Базовыми серверными переменными для настройки лога медленных запросов MySQL являются:
slow_query_log – логическая переменная для включения и выключения лога медленных запросов.
slow_query_log_file – абсолютный путь файла лога запросов. Каталог файла должен принадлежать пользователю mysqld и иметь соответствующие права на чтение и запись. Демон mysql, скорее всего, будет запущен как mysql, но чтобы убедиться в этом, запустите команду в терминале Linux:
Вывод покажет текущего пользователя и пользователя mysqld.
- long_query_time – время в секундах для проверки длины запроса. При значении 5 в логе будут регистрироваться все запросы, обработка которых занимает больше 5 секунд.
- log_queries_not_using_indexes – логическое значение, которое определяет, нужно ли регистрировать запросы, не использующие индексы. При анализе такие запросы важны.
- min_examined_row_limit – определяет минимальное количество строк для анализа. Со значением 1000 все запросы, которые анализируют менее 1000 строк, будут проигнорированы.
Переменные сервера MySQL могут быть установлены в конфигурационном файле MySQL или динамически с помощью пользовательского интерфейса или командной строки MySQL. Если переменные установлены в конфигурационном файле, они будут сохраняться при перезапуске сервера, но для их активации нужно перезагрузить сервер. Конфигурационный файл MySQL обычно находится в /etc/my.cnf или /etc/mysql/my.cnf. Чтобы найти конфигурационный файл, введите (возможно, необходимо расширить поиск на другие корневые каталоги):
Найдя конфигурационный файл, добавьте требуемые переменные в раздел :
Чтобы изменения вступили в силу, нужно перезапустить сервер. Если изменения необходимо активировать немедленно, установите переменные динамически:
Чтобы проверить значения переменных:
Один из недостатков динамического изменения переменных MySQL заключается в том, что переменные будут потеряны при перезагрузке сервера. Потому все важные переменные, которые необходимо сохранить, следует добавить в файл.
Примечание: Синтаксис динамической установки переменных с помощью SET и размещения их в конфигурационном файле немного отличается (например, в первом случае используется slow_query_log, а во втором – slow-query-log). Больше об этом модно узнать в документации MySQL.
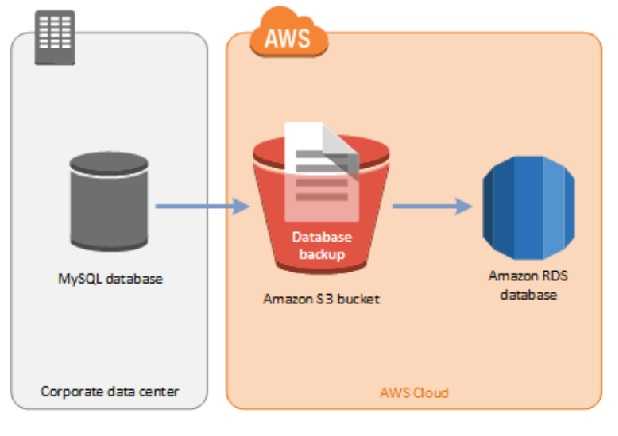
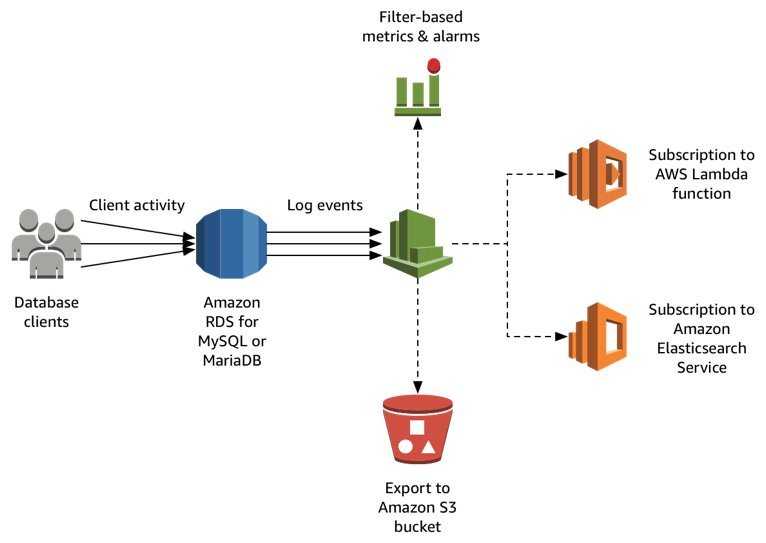
Accessing the MariaDB slow query and general logs
The MariaDB slow query log and the general log can be written to a file or a database
table
by setting parameters in your DB parameter group. For information about creating
and
modifying a DB parameter group, see Working with DB parameter groups. You must set these parameters
before you can view the slow query log or general log in the Amazon RDS console
or by
using the Amazon RDS API, AWS CLI, or AWS SDKs.
You can control MariaDB logging by using the parameters in this list:
-
: To create the slow query log, set to 1. The
default is 0. -
: To create the general log, set to 1. The default is
0. -
: To prevent fast-running queries from being
logged in the slow query log, specify a value for the shortest query
run time to be logged, in seconds. The default is 10 seconds; the
minimum is 0. If log_output = FILE, you can specify a floating point value
that goes to microsecond resolution. If log_output = TABLE, you must specify
an integer value with second resolution. Only queries whose run time
exceeds the value are logged. For
example, setting to 0.1 prevents any
query that runs for less than 100 milliseconds from being logged. -
: To log all queries that do not use
an index to the slow query log, set this parameter to 1. The default is 0.
Queries that do not use an index are logged even if their run time is
less than the value of the
parameter. -
: You can specify one
of the following options for the parameter:-
TABLE (default)– Write
general queries to the table, and
slow queries to the table. -
FILE– Write both general
and slow query logs to the file system. Log files are rotated
hourly. -
NONE– Disable
logging.
-
When logging is enabled, Amazon RDS rotates table logs or deletes log files at regular
intervals. This measure is
a precaution to reduce the possibility of a large log file either blocking database
use or
affecting performance. and logging approach rotation and
deletion as follows:
-
When logging is enabled, log files are examined every hour and log files
older than 24 hours are deleted. In some cases, the remaining combined log file
size after the deletion might exceed the threshold of 2 percent of a DB
instance’s allocated space. In these cases, the largest log files are deleted
until the log file size no longer exceeds the threshold. -
When logging is enabled, in some cases log tables are rotated every 24
hours. This rotation occurs if the space used by the table logs is more than
20
percent of the allocated storage space or the size of all logs combined is
greater than 10 GB. If the amount of space used for a DB instance is greater
than 90 percent of the DB instance’s allocated storage space, then the
thresholds for log rotation are reduced. Log tables are then rotated if the
space used by the table logs is more than 10 percent of the allocated storage
space or the size of all logs combined is greater than 5 GB.When log tables are rotated, the current log table is copied to a backup log table
and the
entries in the current log table are removed. If the backup log table already
exists, then it is
deleted before the current log table is copied to the backup. You can query
the backup log table
if needed. The backup log table for the table is named
. The backup log table for the table is named
.You can rotate the table
by calling the procedure.
You can rotate the table
by calling the procedure.Table logs are rotated during a database version upgrade.
Amazon RDS records both and log rotation in an Amazon RDS event and
sends you a notification.
To work with the logs from the Amazon RDS console, Amazon RDS API, Amazon RDS CLI,
or AWS SDKs, set the
parameter to FILE. Like the MariaDB error log,
these log files are rotated hourly. The log files that were generated during the
previous
24 hours are retained.
For more information about the slow query and general logs, go to the following topics
in
the MariaDB documentation:
Configuring the Slow Query Log Filename
By default, the slow query log is written to in the directory. However, this can be changed.
One way to configure the slow query log filename is to set the system variable. It can be changed dynamically with . For example:
SET GLOBAL slow_query_log_file='mariadb-slow.log';
It can also be set in a server in an option file prior to starting up the server. For example:
...
slow_query_log
slow_query_log_file=mariadb-slow.log
If it is a relative path, then the is relative to the directory.
However, the system variable can also be an absolute path. For example:
...
slow_query_log
slow_query_log_file=/var/log/mysql/mariadb-slow.log
Another way to configure the slow query log filename is to set the option, which configures MariaDB to use a common prefix for all log files (e.g. slow query log, general query log, error log, binary logs, etc.). The slow query log filename will be built by adding to this prefix. This option cannot be set dynamically. It can be set in a server in an option file prior to starting up the server. For example:
...
log-basename=mariadb
slow_query_log
The cannot be an absolute path. The log file name is relative to the directory.
Logging User Activities
The Audit Plugin will log the database activities of all users, or only the users that you specify. A database activity is defined as a query event or a table event. Connect events are logged for all users.
You may specify users to include in the log with the variable or exclude users with the variable. This can be useful if you would like to log entries, but are not interested in entries from trusted applications and would like to exclude them from the logs.
You would typically use either the variable or the variable. You may, though, use both variables. If a username is inadvertently listed in both variables, database activities for that user will be logged because takes priority.
Although MariaDB considers a user as the combination of the username and hostname, the Audit Plugin logs only based on the username. MariaDB uses both the username and hostname so as to grant privileges relevant to the location of the user. Privileges are not relevant though for tracing the access to database objects. The host name is still recorded in the log, but logging is not determined based on that information.
The following example shows how to add a new username to the variable without removing previous usernames:
SET GLOBAL server_audit_incl_users = CONCAT(@@global.server_audit_incl_users, ',Maria');
Remember to add also any new users to be included in the logs to the same variable in MariaDB configuration file. Otherwise, when the server restarts it will discard the setting.
Step 3 — Enabling and Listing Binary Logs
The binary log contains events that manipulate the database. If you want to recover the database, you need a backup and a binary log relevant to this backup. There are multiple binary logs because they are versioned.
Enabling Binary Logs
By default, the binary logs are disabled. You can enable binary logs by editing MariaDB configuration file ( required):
The file contains the following lines that hold configuration variable (by default commented out):
You can enable binary logging by uncommenting the line with this variable and set up the to the absolute path to the directory where you want to store them:
In our example, we change the directory to the , same as for the error and general query logs. Now, you can save the file.
Listing Binary Logs
At last, let’s check the binary log configuration in the MariaDB server. Let’s connect to the MariaDB server as a root client:
You will be redirected to MariaDB prompt.
Now, you can check the binary logs status by executing :
The command will list the binary log files on the server:
The output shows all binary logs. We enable this service just a minute ago, soo there is just a single file. However, there will be more binary logs indexed with increasing suffix (for example, , ) Now, we can find out where are these logs stored.
We can show logs location by executing command :
We already use this clause in the previous step. This time, the clause shows variables that contain the string . You’ll see the program’s output appear on the screen:
The output shows that the binary logs are stored in directory , as we set up in the configuration file.
We can disconnect from the server by executing the command:
You will be redirected back to the terminal.
Viewing the Binary Log
The binary logs are not plain text files and you can not read them with the text editor. However, the MariaDB includes command-line utility .
You can view the binary log with this utility by executing the following command ( required because the file is maintained by the system):
You’ll see the program’s output appear on the screen:
The output shows an encoded binary log. You can see the warning, which told us that the log is still in use. You can read about the format and meaning of each record in this log in the manual pages (). The purpose of the binary log is to allow replication, as well as assisting in backup operations.
Description
The statement clears or reloads various internal caches used by
MariaDB. To execute , you must have the
privilege. See GRANT.
The statement is similar to . See
RESET.
You cannot issue a FLUSH statement from within a stored function or a trigger. Doing so within a stored procedure is permitted, as long as it is not called by a stored function or trigger. See Stored Routine Limitations, Stored Function Limitations and Trigger Limitations.
If a listed table is a view, an error like the following will be produced:
ERROR 1347 (HY000): 'test.v' is not BASE TABLE
By default, statements are written to the binary log and will be replicated. The keyword ( is an alias) will ensure the statement is not written to the binary log.
The different flush options are:
| Option | Description |
|---|---|
| Internal command used for backup purposes. See the Information Schema CHANGED_PAGE_BITMAPS Table. | |
| Reset client statistics (see SHOW CLIENT_STATISTICS). | |
| Reloads the DES key file (Specified with the —des-key-file startup option). | |
| Flush the hostname cache (used for converting ip to host names and for unblocking blocked hosts. See ) | |
| Reset index statistics (see SHOW INDEX_STATISTICS). | |
| Close and reopen the specified log type, or all log types if none are specified. can be used to flush the relay logs for a specific connection. Only one connection can be specified per command. See Multi-source replication. will delete all unneeded Aria redo logs. Since MariaDB 10.1.30 and MariaDB 10.2.11, can be used to discard obsolete GTID domains from the server’s binary log state. In order for this to be successful, no event group from the listed GTID domains can be present in existing binary log files. If some still exist, then they must be purged prior to executing this command. If the command completes successfully, then it also rotates the binary log. | |
| Deprecated option, use RESET MASTER instead. | |
| Reload all privileges from the privilege tables in the database. If the server is started with option, this will activate the privilege tables again. | |
| QUERY CACHE | Defragment the query cache to better utilize its memory. If you want to reset the query cache, you can do it with RESET QUERY CACHE. |
| See the QUERY_RESPONSE_TIME plugin. | |
| Deprecated option, use RESET REPLICA or RESET SLAVE instead. | |
| Used to dynamically reinitialize the server’s TLS context by reloading the files defined by several TLS system variables. See for more information. This command was first added in MariaDB 10.4.1. | |
| Resets all server status variables that can be reset to 0. Not all global status variables support this, so not all global values are reset. See for more information. | |
| Close tables given as options or all open tables if no table list was used. From MariaDB 10.4.1, using without any table list will only close tables not in use, and tables not locked by the FLUSH TABLES connection. If there are no locked tables, FLUSH TABLES will be instant and will not cause any waits, as it no longer waits for tables in use. When a table list is provided, from MariaDB 10.4.1, the server will wait for the end of any transactions that are using the tables. Previously, FLUSH TABLES only waited for the statements to complete. | |
| Same as . | |
| For InnoDB tables, flushes table changes to disk to permit binary table copies while the server is running. Introduced in MariaDB 10.0.8. See FLUSH TABLES … FOR EXPORT for more. | |
| Closes all open tables. New tables are only allowed to be opened with read locks until an UNLOCK TABLES is given. | |
| As but also disable all checkpoint writes by transactional table engines. This is useful when doing a disk snapshot of all tables. | |
| Reset table statistics (see SHOW TABLE_STATISTICS). | |
| Resets all per hour . This enables clients that have exhausted their resources to connect again. | |
| Reset user statistics (see SHOW USER_STATISTICS). |
You can also use the mysqladmin client to flush things. Use to examine what flush commands it supports.
Choosing the General Query Log Output Destination
The general query log can either be written to a file on disk, or it can be written to the table in the database. To choose the general query log output destination, set the system variable.
Writing the General Query Log to a File
The general query log is output to a file by default. However, it can be explicitly chosen by setting the system variable to . It can be changed dynamically with . For example:
SET GLOBAL log_output='FILE';
It can also be set in a server in an option file prior to starting up the server. For example:
...
log_output=FILE
general_log
general_log_file=queries.log
Writing the General Query Log to a Table
The general query log can either be written to the table in the database by setting the system variable to . It can be changed dynamically with . For example:
SET GLOBAL log_output='TABLE';
It can also be set in a server in an option file prior to starting up the server. For example:
...
log_output=TABLE
general_log
Some rows in this table might look like this:
SELECT * FROM mysql.general_log\G
*************************** 1. row ***************************
  event_time: 2014-11-11 08:40:04.117177
   user_host: root @ localhost []
   thread_id: 74
   server_id: 1
command_type: Query
    argument: SELECT * FROM test.s
*************************** 2. row ***************************
  event_time: 2014-11-11 08:40:10.501131
   user_host: root @ localhost []
   thread_id: 74
   server_id: 1
command_type: Query
    argument: SELECT * FROM mysql.general_log
...
See Writing logs into tables for more information.
Logrotate in Ansible
Let’s see an example of how to configure logrotate in Ansible.
First, we’ll create a couple of tasks in our playbook:
- name: Create mariadb_logrotate_old_dir
  file:
    path: "` mariadb_logrotate_old_dir `"
    owner: mysql
    group: mysql
    mode: '770'
    state: directory

- name: Configure logrotate
  template:
    src: "../templates/logrotate.j2"
    dest: "/etc/logrotate.d/mysql"
The first task creates a directory to store the old, compressed logs, and set proper permissions.
The second task uploads logrotate configuration file into the proper directory, and calls it . As you can see the original name is different, and it ends with the extension, because it is a Jinja 2 template.
The file will look like the following:
` mariadb_log_dir `/* {
        su mysql mysql
        missingok
        create 660 mysql mysql
        notifempty
        daily
        minsize 1M ` mariadb_logrotate_min_size `
        maxsize 100M ` mariadb_logrotate_max_size `
        rotate ` mariadb_logrotate_old_dir `
        dateformat .%Y-%m-%d-%H-%M-%S # only use with logrotate >= 3.9.2
        compress
        delaycompress
        sharedscripts
        olddir archive/
        createolddir 770 mysql mysql # only use with logrotate >= 3.8.9
    postrotate
        # just if mysqld is really running
        if test -x /usr/bin/mysqladmin && \
           /usr/bin/mysqladmin ping &>/dev/null
        then
           /usr/bin/mysqladmin --local flush-error-log \
              flush-engine-log flush-general-log flush-slow-log
        fi
    endscript
}
The file is very similar to the file shown above, which is obvious because we’re still uploading a logrotate configuration file. Ansible is just a tool we’ve chosen to do this.
However, both in the tasks and in the template, we used some variables. This allows to use different paths and rotation parameters for different hosts, or host groups.
If we have a group host called that contains the default configuration for all our MariaDB servers, we can define these variables in a file called :
# MariaDB writes its logs here
mariadb_log_dir: /var/lib/mysql/logs

# logrotate configuration

mariadb_logrotate_min_size: 500M
mariadb_logrotate_max_size: 1G
mariadb_logrotate_old_files: 7
mariadb_logrotate_old_dir: /var/mysql/old-logs
After setting up logrotate in Ansible, you may want to deploy it to a non-production server and test it manually as explained above. Once you’re sure that it works fine on one server, you can be confident in the new Ansible tasks and deploy them on all servers.
Опции программы проверки
Вы можете проверить, какие параметры будет использовать данная программа, используя командной строки —print-defaults :
| Option | Description |
|---|---|
| Считайте опции из файлов опций,распечатайте все значения опций,а затем выйдите из программы. |
Этот аргумент командной строки можно использовать с большинством инструментов командной строки MariaDB, а не только с . Он должен быть указан в качестве первого аргумента в командной строке. Например:
$ mysqldump --print-defaults
mysqldump would have been started with the following arguments:
--ssl_cert=/etc/my.cnf.d/certificates/client-cert.pem --ssl_key=/etc/my.cnf.d/certificates/client-key.pem --ssl_ca=/etc/my.cnf.d/certificates/ca.pem --ssl-verify-server-cert --max_allowed_packet=1GB
Вы также можете проверить, какие параметры будет использовать данная программа, используя утилиту и указав имена групп параметров, которые программа читает. Например:
$ my_print_defaults mysqldump client client-server client-mariadb
--ssl_cert=/etc/my.cnf.d/certificates/client-cert.pem
--ssl_key=/etc/my.cnf.d/certificates/client-key.pem
--ssl_ca=/etc/my.cnf.d/certificates/ca.pem
--ssl-verify-server-cert
--max_allowed_packet=1GB
Параметр утилиты предоставляет ярлык для ссылки на все группы параметров :
$ my_print_defaults --mysqld
--log_bin=mariadb-bin
--log_slave_updates=ON
--ssl_cert=/etc/my.cnf.d/certificates/server-cert.pem
--ssl_key=/etc/my.cnf.d/certificates/server-key.pem
--ssl_ca=/etc/my.cnf.d/certificates/ca.pem